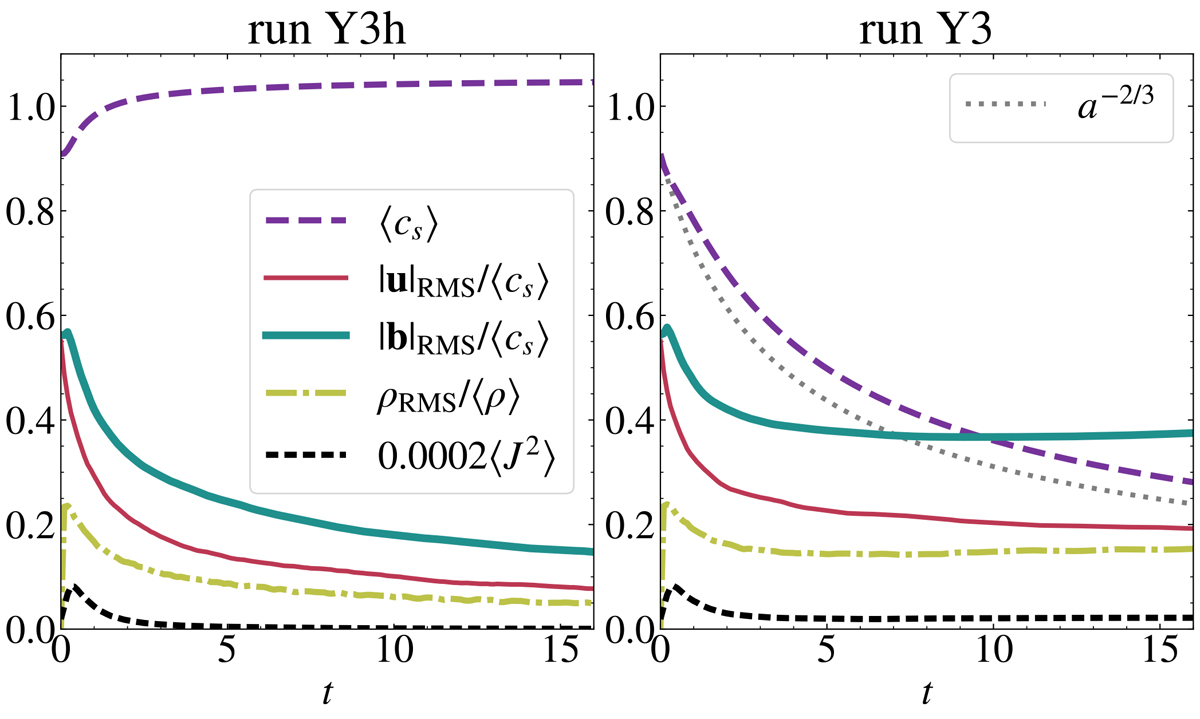
Fig. 9.
Download original image
Root mean square amplitude of fluctuations for runs Y3h (no expansion, left panel) and Y3 (ɛ0 = 0.4, right panel). Magnetic (green) and velocity (red) fluctuations are normalised to the average sound speed (magnetic fluctuations are expressed in Alfvén units before normalisation, see text), while density fluctuations (light green, dash-dotted) are normalised to the average density. The average sound speed and the square of the current density are also plotted with purple and black dashed lines, respectively. In the right panel, the predicted a−2/3 decay for sound speed is drawn as a grey dotted line.
Current usage metrics show cumulative count of Article Views (full-text article views including HTML views, PDF and ePub downloads, according to the available data) and Abstracts Views on Vision4Press platform.
Data correspond to usage on the plateform after 2015. The current usage metrics is available 48-96 hours after online publication and is updated daily on week days.
Initial download of the metrics may take a while.