Fig. 5.
Download original image
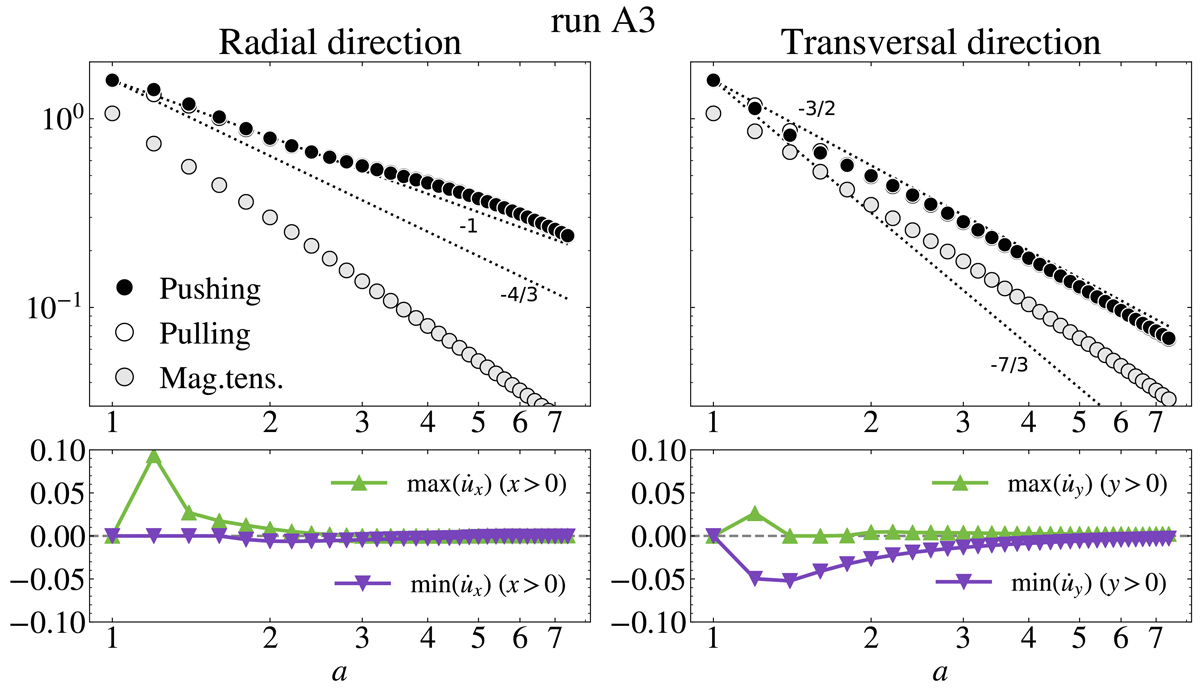
Run A3. Evolution of the peaks of the dynamical terms with heliocentric distance, along x (left) and y (right). The peaks are computed inside the region of non-zero pinch tracer in order to filter out the shock fronts that propagate outwards. The top panels show the absolute value of the main terms: pushing and pulling terms are drawn with black and white filled circles, and magnetic tension with light grey circles; dotted black lines represent the predicted scaling laws for magnetic and kinetic pressure gradient terms as shown in Eq. (22). The bottom panels show the maximum and minimum of the resultant, in green and purple respectively. All the terms are in code units.
Current usage metrics show cumulative count of Article Views (full-text article views including HTML views, PDF and ePub downloads, according to the available data) and Abstracts Views on Vision4Press platform.
Data correspond to usage on the plateform after 2015. The current usage metrics is available 48-96 hours after online publication and is updated daily on week days.
Initial download of the metrics may take a while.