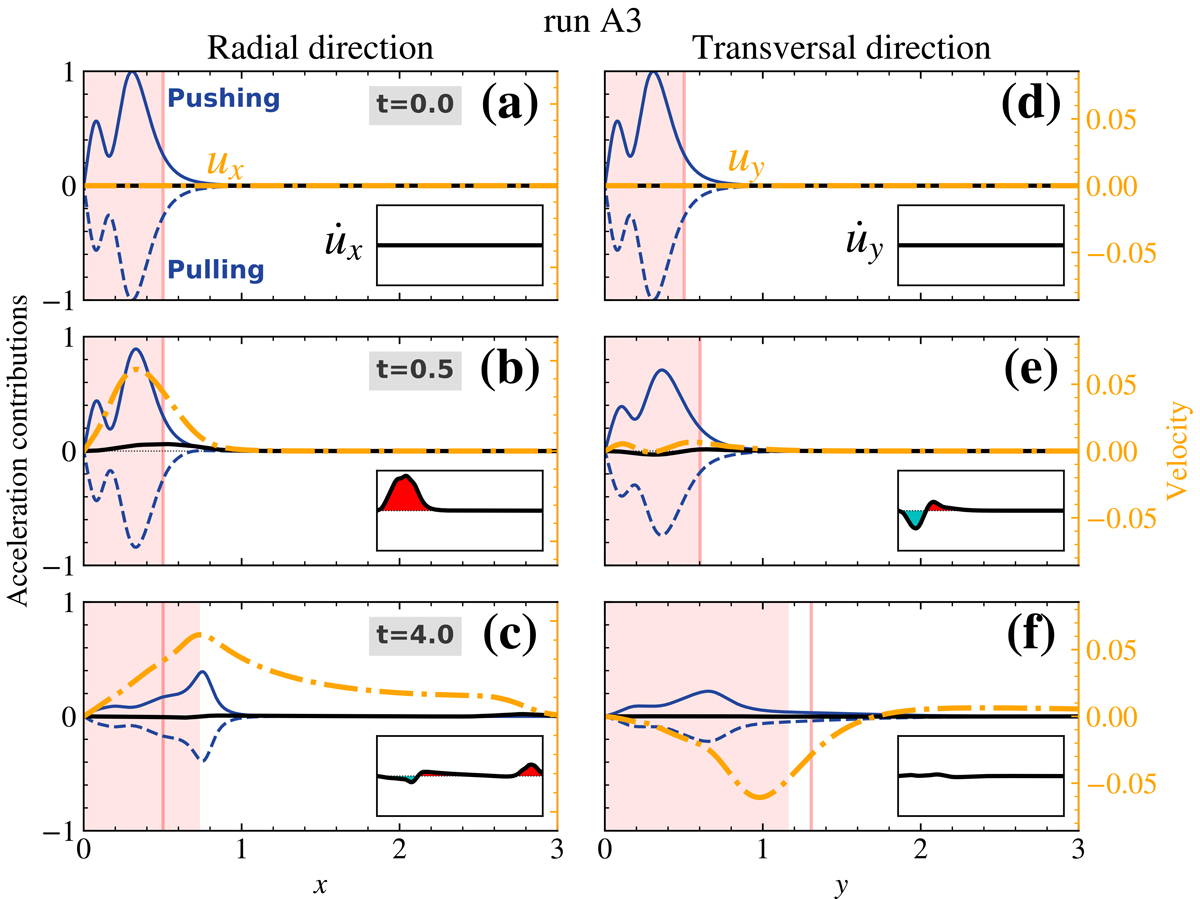
Fig. 4.
Download original image
Run A3. Evolution of the main dynamical terms (solid and dashed blue lines), their resultant (black line), and the velocity field (dash-dotted orange line, different scale), along both x (left panels) and y (right panels). The 1D cuts are taken at half domain (i.e. they intersect the flux rope axis). All the quantities are in code units and the dynamical terms are re-scaled relative to their maximum at t = 0. Only the right half of each 1D spatial domain is shown, since the dynamics is just inverted in the other half (axial symmetry). The computed (expected) pinch tracer size is shown as a filled light pink region (vertical line) for each snapshot. In the bottom right corner of each panel, an inset shows the resultant acceleration, ![]() , as a black line filled with red or cyan according to its positive or negative sign.
, as a black line filled with red or cyan according to its positive or negative sign.
Current usage metrics show cumulative count of Article Views (full-text article views including HTML views, PDF and ePub downloads, according to the available data) and Abstracts Views on Vision4Press platform.
Data correspond to usage on the plateform after 2015. The current usage metrics is available 48-96 hours after online publication and is updated daily on week days.
Initial download of the metrics may take a while.