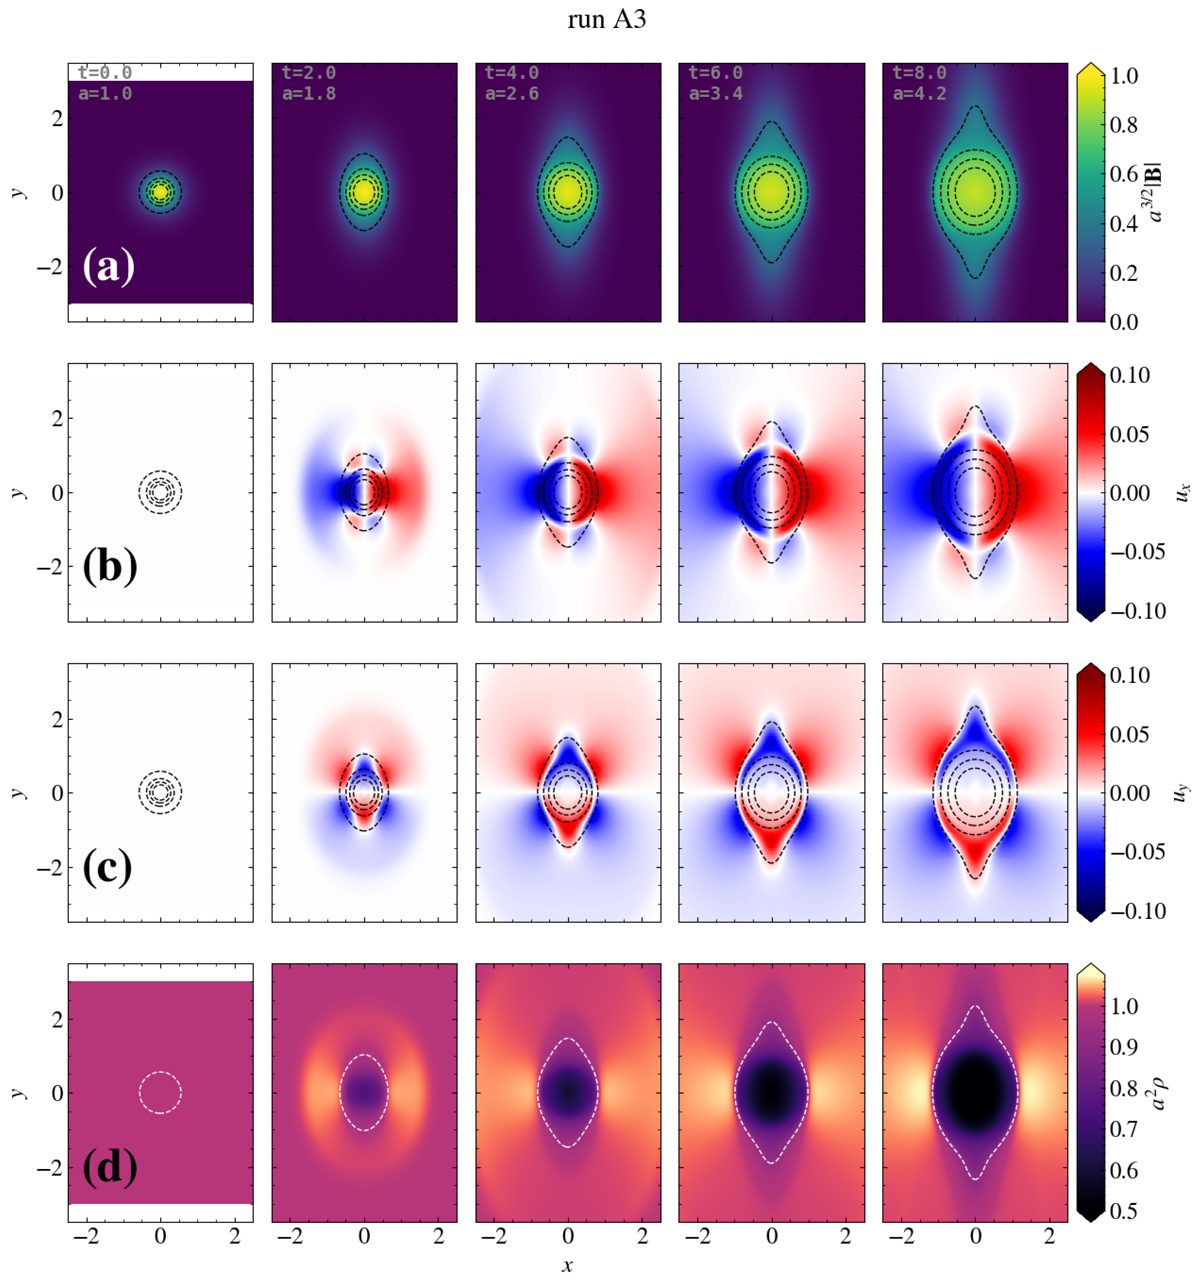
Fig. 3.
Download original image
Run A3. From top to bottom: evolution of magnetic field |B| (a), velocity ux (b) and uy (c), and density ρ (d). For |B| and ρ, the fields’ decay with heliocentric distance has been compensated for better visualisation. The in-plane magnetic field is represented in panels (a-c) as constant-Az black lines, whereas the outermost boundary of the pinch tracer is represented in panel (d) as a dashed white line. All the quantities are in code units.
Current usage metrics show cumulative count of Article Views (full-text article views including HTML views, PDF and ePub downloads, according to the available data) and Abstracts Views on Vision4Press platform.
Data correspond to usage on the plateform after 2015. The current usage metrics is available 48-96 hours after online publication and is updated daily on week days.
Initial download of the metrics may take a while.