Fig. 16.
Download original image
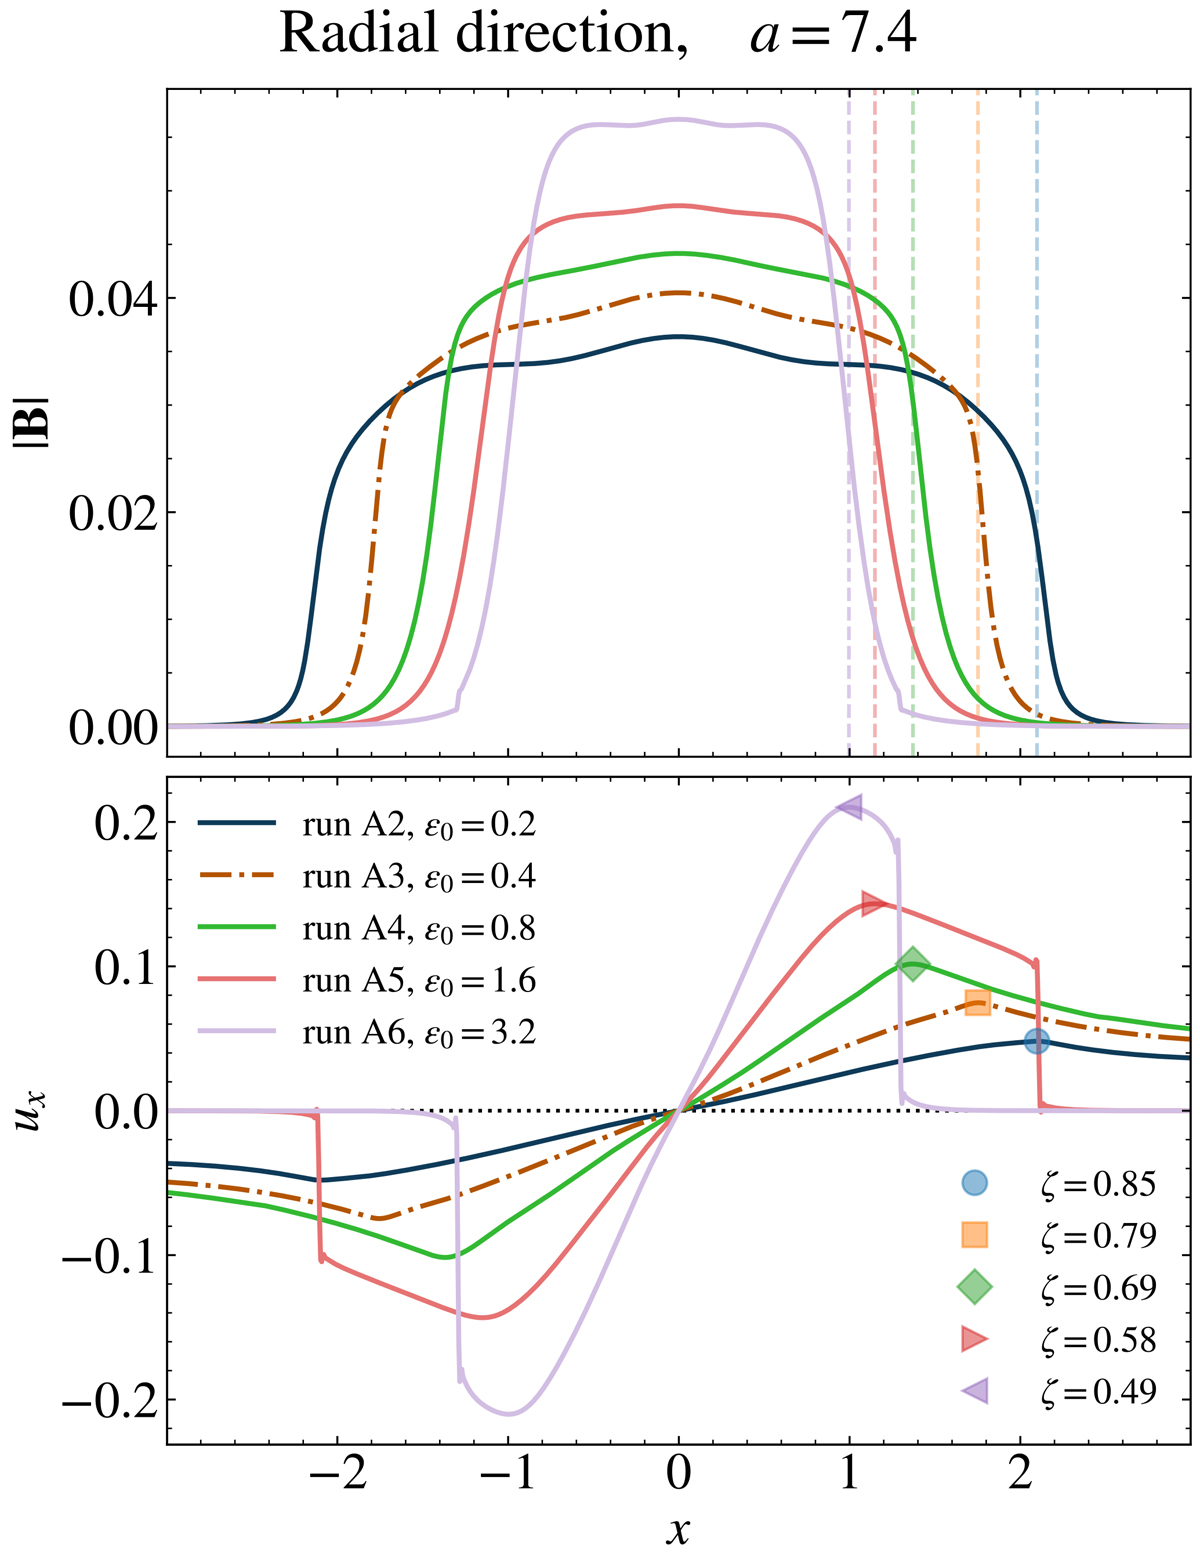
Total magnetic field intensity |B| (top panel) and radial velocity ux (bottom panel) for runs A2-A6, along a radial cut through the flux rope axis, for the final times (R≃1 AU). In the bottom panel, the peak of ux is drawn with markers (the same as in Fig. 15 for each run) and labelled with the corresponding estimate of the non-dimensional expansion parameter ζ; the position corresponding to the peak is drawn as a light dashed vertical line in the top panels, to compare it to the magnetic boundaries. Run A3 is shown as a dash-dotted line in both panels.
Current usage metrics show cumulative count of Article Views (full-text article views including HTML views, PDF and ePub downloads, according to the available data) and Abstracts Views on Vision4Press platform.
Data correspond to usage on the plateform after 2015. The current usage metrics is available 48-96 hours after online publication and is updated daily on week days.
Initial download of the metrics may take a while.