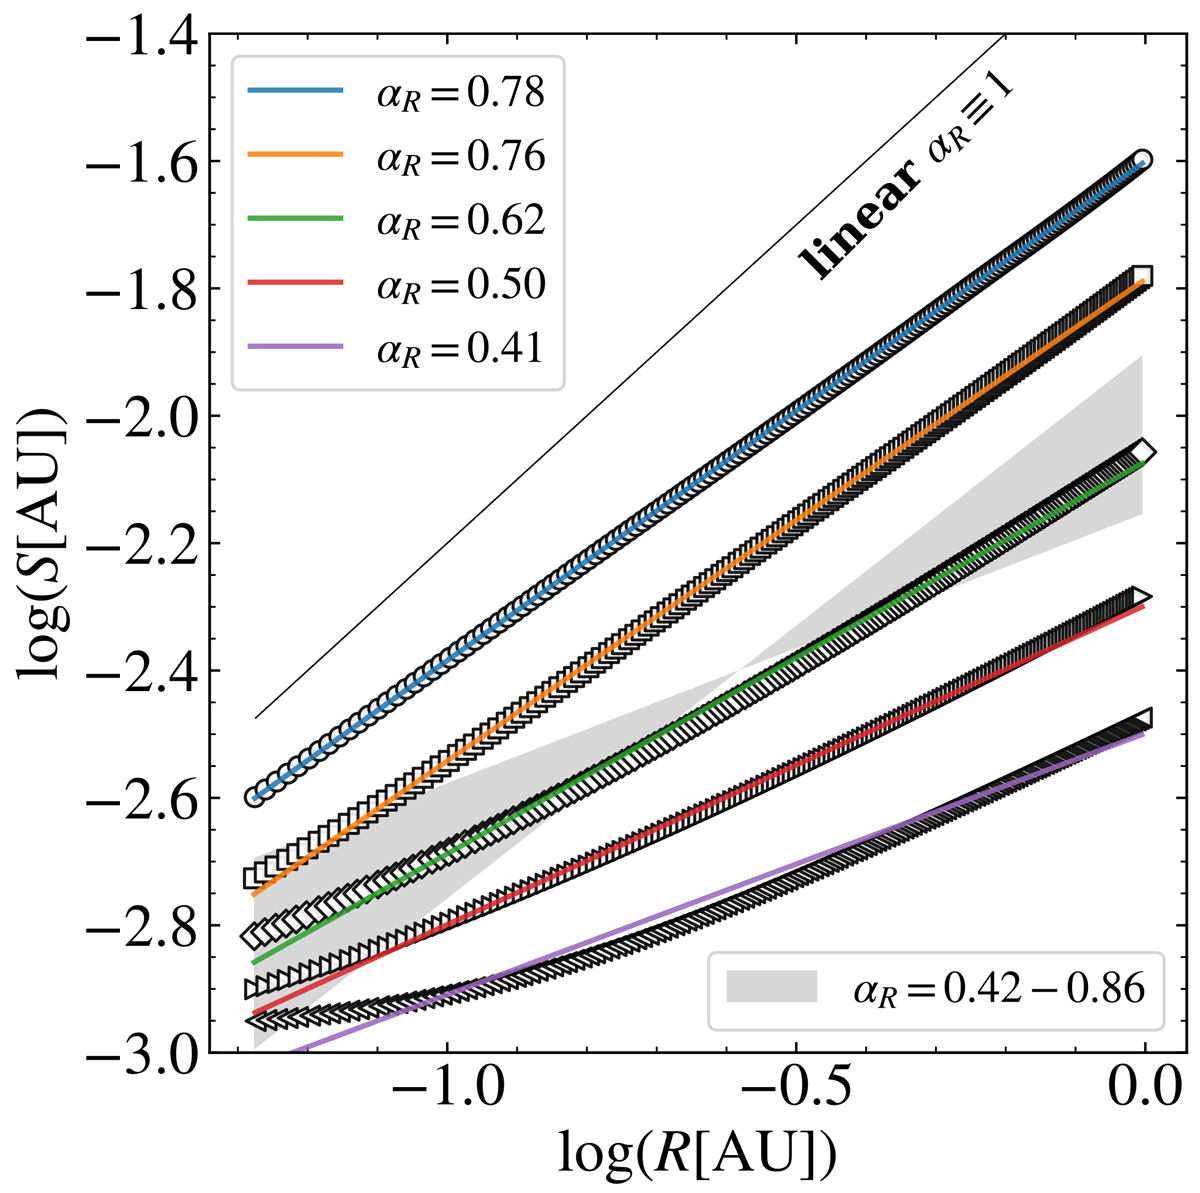
Fig. 15.
Download original image
Heliospheric evolution of the flux rope radial size S[AU] versus distance R[AU] for runs A2-A6. Only the range a>2 (R>0.29 AU) is considered, to avoid the first dynamical transient for most runs (even though it is still visible and important in runs A4-A6). The estimates of S using σx are drawn as markers (different shapes for different runs), and each run has been fitted with a power law (solid lines with different colours). The solid thin black line is the linear (αR≡1) trend. The shaded grey area highlights the range between the minimum and maximum αR values obtained by randomly sampling data points from the combined set of runs A2-A6 (see text for details).
Current usage metrics show cumulative count of Article Views (full-text article views including HTML views, PDF and ePub downloads, according to the available data) and Abstracts Views on Vision4Press platform.
Data correspond to usage on the plateform after 2015. The current usage metrics is available 48-96 hours after online publication and is updated daily on week days.
Initial download of the metrics may take a while.