Fig. 13.
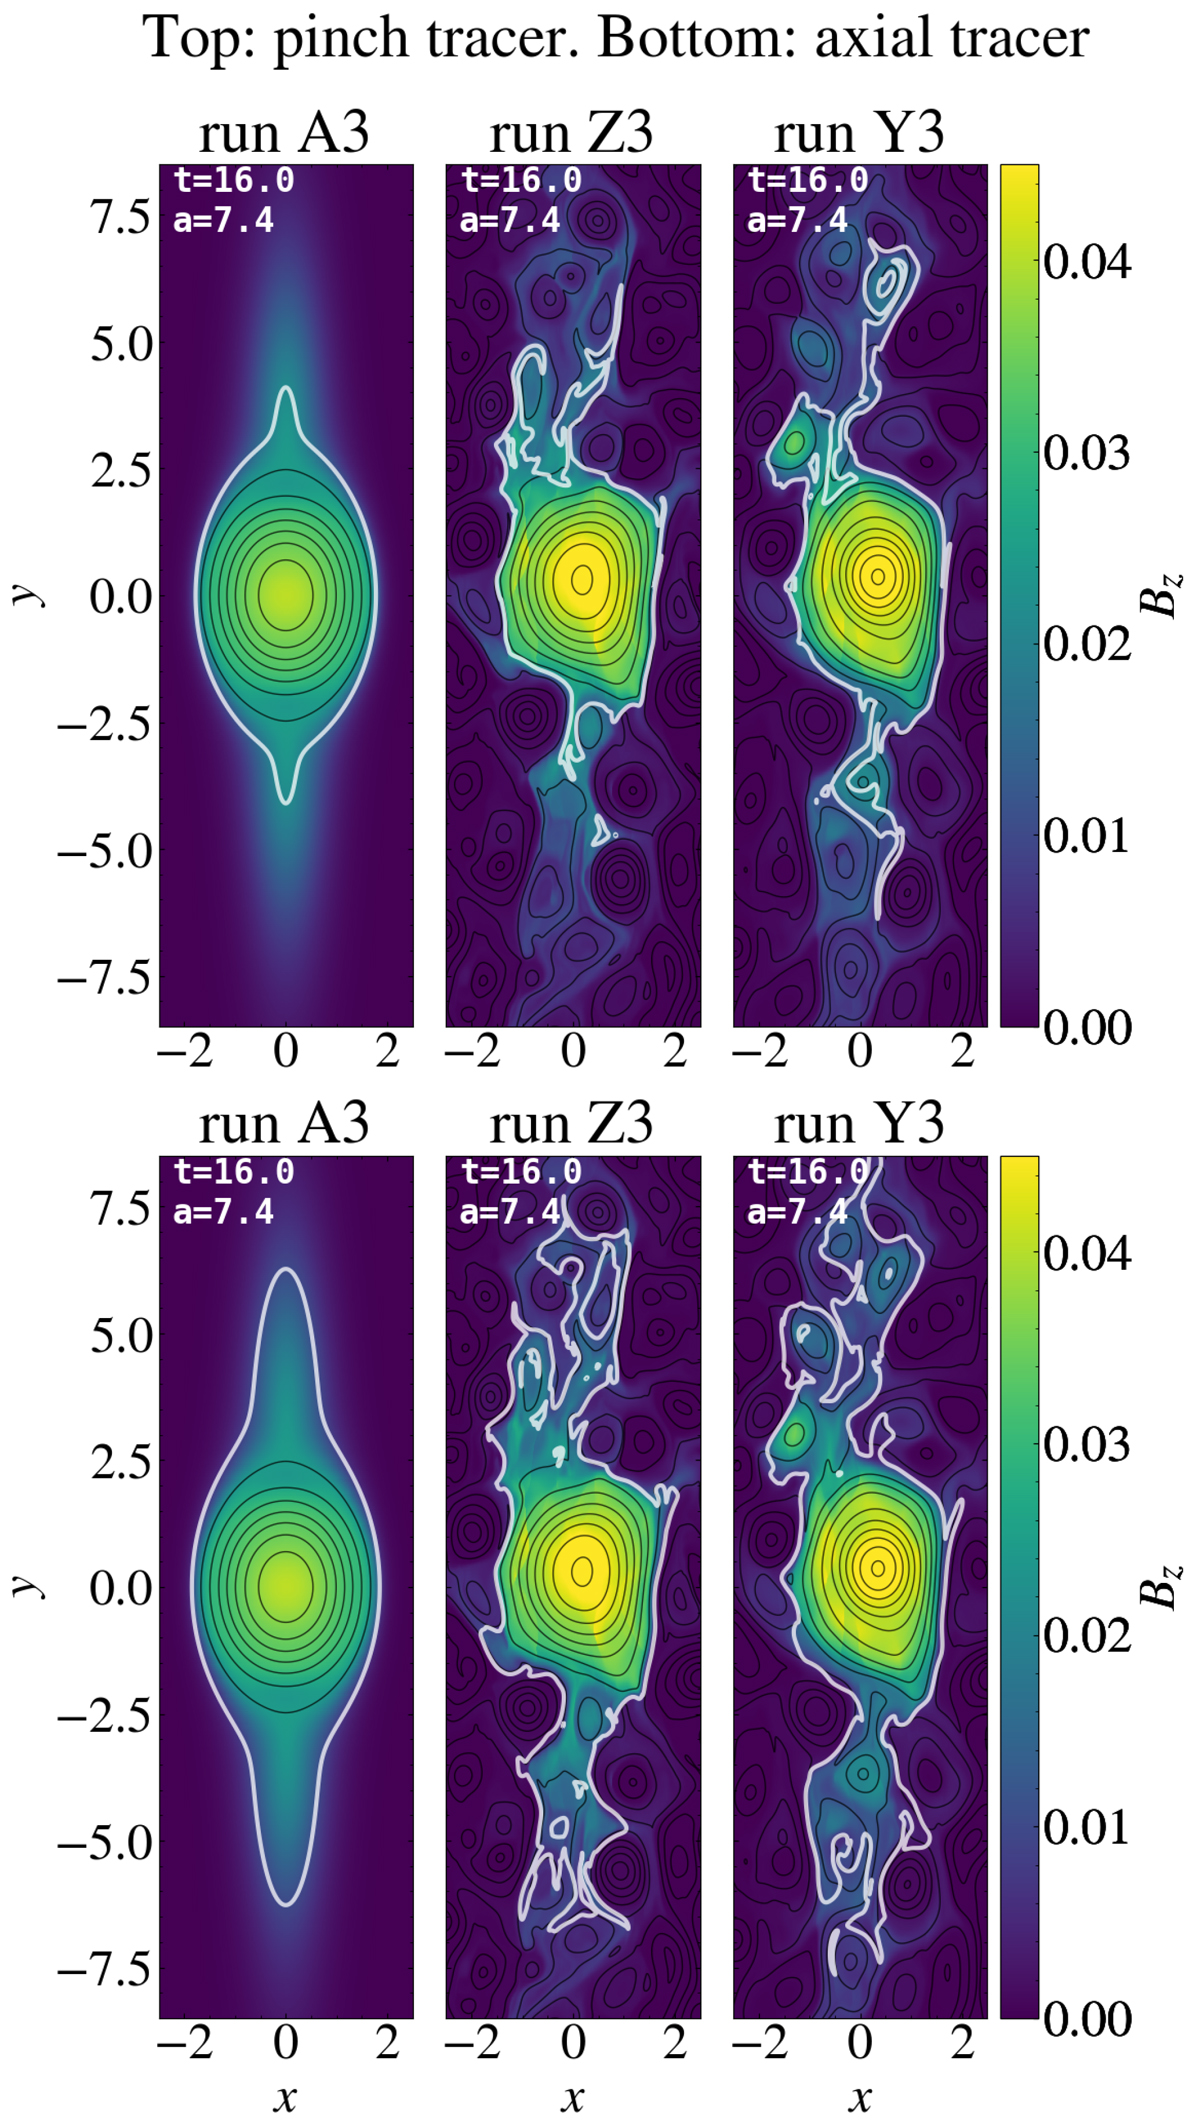
Download original image
Snapshot at t = 16.0 (a = 7.4) of the magnetic field for runs A3 (isolated flux rope), Z3 (with fluctuations smaller inside the flux rope by a factor 5), and Y3 (with equal fluctuation amplitude everywhere). The axial field Bz is represented by the colour-coded map, whereas the in-plane magnetic field is represented with constant-Az black lines. The two rows show the same fields (colour map and black iso-contours) but differ for the tracer, which is plotted with a thick white line: in the top row, we show the pinch tracer that is initially co-spatial with the in-plane (poloidal) magnetic field; in the bottom row, the white lines bound the axial tracer that is initialised in the same region occupied by the out-of-plane (axial) magnetic field.
Current usage metrics show cumulative count of Article Views (full-text article views including HTML views, PDF and ePub downloads, according to the available data) and Abstracts Views on Vision4Press platform.
Data correspond to usage on the plateform after 2015. The current usage metrics is available 48-96 hours after online publication and is updated daily on week days.
Initial download of the metrics may take a while.