Fig. 12.
Download original image
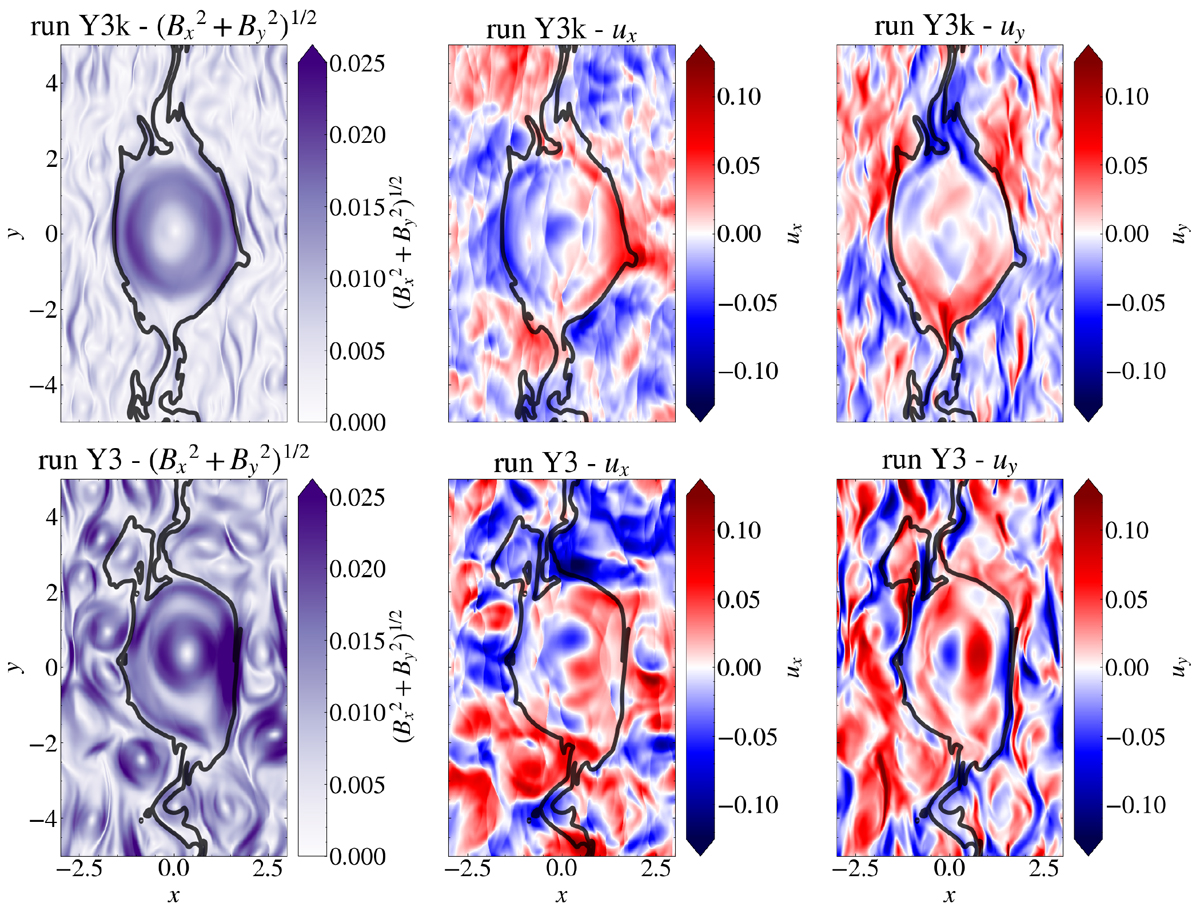
Maps of the in-plane magnetic field, ![]() (left panels, colour coded) and of the two components of the velocity field, ux and uy (central and right panels, colour coded), at t = 16. The pinch tracer edge is drawn as a solid black line. Top and bottom panels represent runs Y3k and Y3 respectively, which differ in the excited scales of initial random fluctuations: run Y3k has k≥4kFR and run Y3 has k≥kFR.
(left panels, colour coded) and of the two components of the velocity field, ux and uy (central and right panels, colour coded), at t = 16. The pinch tracer edge is drawn as a solid black line. Top and bottom panels represent runs Y3k and Y3 respectively, which differ in the excited scales of initial random fluctuations: run Y3k has k≥4kFR and run Y3 has k≥kFR.
Current usage metrics show cumulative count of Article Views (full-text article views including HTML views, PDF and ePub downloads, according to the available data) and Abstracts Views on Vision4Press platform.
Data correspond to usage on the plateform after 2015. The current usage metrics is available 48-96 hours after online publication and is updated daily on week days.
Initial download of the metrics may take a while.