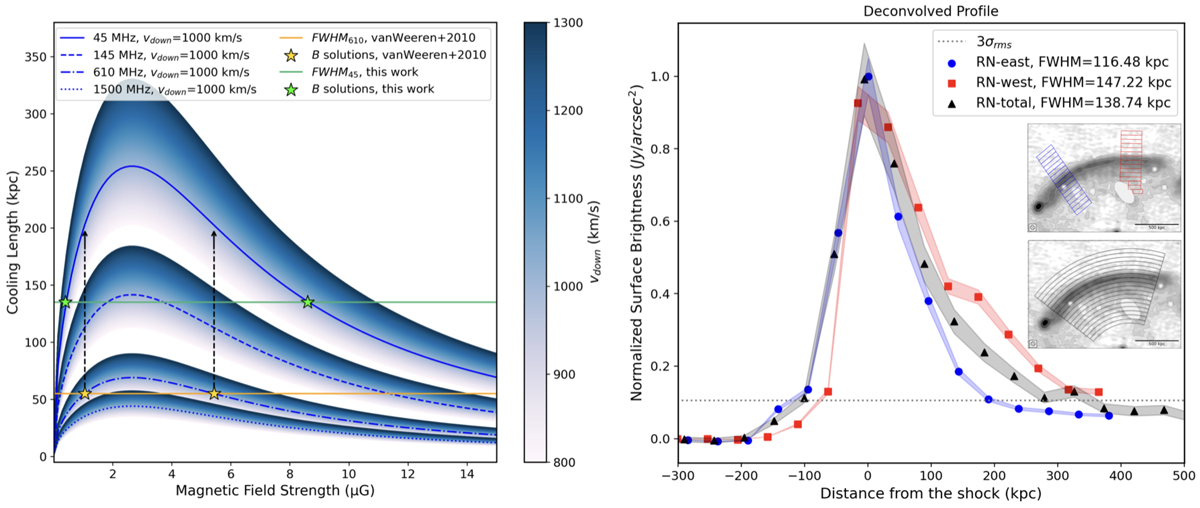
Fig. 9.
Download original image
Theoretical relic cooling lengths compared with the deconvolved surface brightness profile of RN. Left: relationship between the cooling length (i.e. the relic thickness under ideal conditions of no projection effects and pure radiative losses), magnetic field strength, and varying downstream velocity. Yellow stars represent the B solutions from van Weeren et al. (2010), while the green stars are the values from the analysis at 45 MHz. As a comparison, the vertical dashed arrows indicate the expected full width half maximum FWHM45 MHz at low frequency, corresponding to the extrapolated values from the relic B solutions derived from FWHM610 MHz. Right: normalized surface brightness versus distance from the shock. Negative values correspond to the upstream region, while positive ones correspond to the downstream. Data points represent measurements extracted from the LOFAR model-image at 45 MHz along the eastern half (blue), western half (red) and full length (black) of the main relic RN. The dotted horizontal line indicates the image noise level of 3σrms = 1.70 × 10⁻⁵ Jy/arcsec2. The insets show the 15″-spaced extraction regions, with black 500 kpc scale bar in the bottom right corner.
Current usage metrics show cumulative count of Article Views (full-text article views including HTML views, PDF and ePub downloads, according to the available data) and Abstracts Views on Vision4Press platform.
Data correspond to usage on the plateform after 2015. The current usage metrics is available 48-96 hours after online publication and is updated daily on week days.
Initial download of the metrics may take a while.