Fig. 8.
Download original image
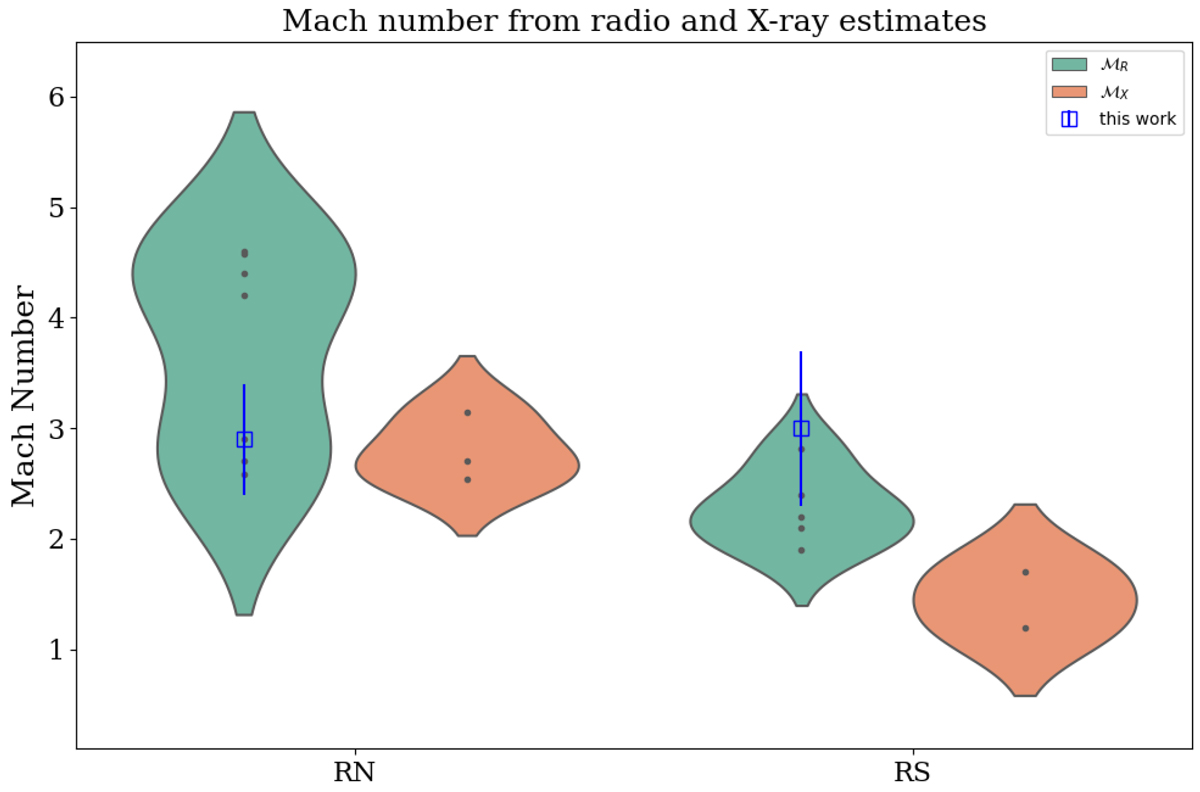
Mach number estimates for northern (RN) and southern (RS) radio shocks in CIZA J2242.8+5301, derived from the radio spectral index (ℳR, teal) and the ICM X-ray analysis (ℳX, orange). The violin plots illustrate the distribution of Mach number estimates from the literature (listed in Table 4), highlighting the range and density of measured values. Overlaid points represent individual measurements, while the blue empty squares are the values derived in this work (see Sect. 4.1).
Current usage metrics show cumulative count of Article Views (full-text article views including HTML views, PDF and ePub downloads, according to the available data) and Abstracts Views on Vision4Press platform.
Data correspond to usage on the plateform after 2015. The current usage metrics is available 48-96 hours after online publication and is updated daily on week days.
Initial download of the metrics may take a while.