Fig. 7.
Download original image
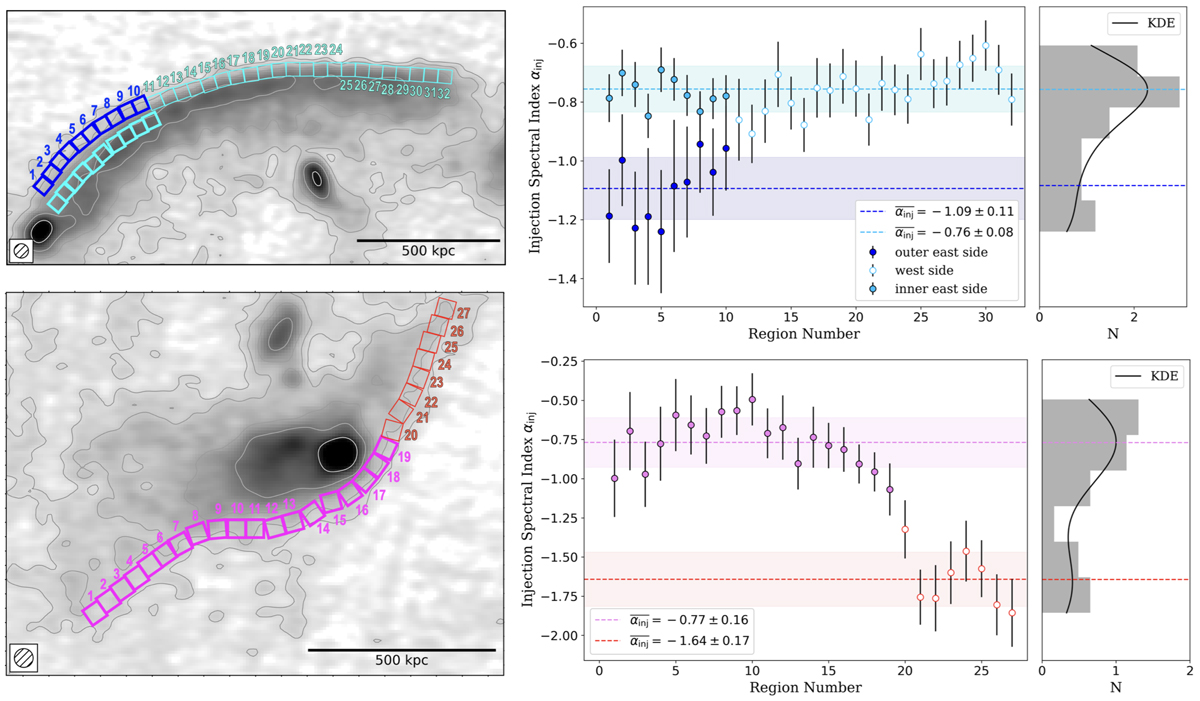
Injection spectral index calculated in 15″-box (∼48 kpc separation) along the relics’ edges. Left: zoom-in over the RN (top) and RS (bottom). Right: injection spectral index profiles extracted from 45 to 145 MHz 15″-resolution images. The right panels display the density-normalized histograms together with a kernel density estimation (KDE) curve for a smooth and continuous representation of the data distribution. For each relic, the data are colour-coded by the different groups identified by the GMM. The GMM means are plotted as horizontal dashed lines.
Current usage metrics show cumulative count of Article Views (full-text article views including HTML views, PDF and ePub downloads, according to the available data) and Abstracts Views on Vision4Press platform.
Data correspond to usage on the plateform after 2015. The current usage metrics is available 48-96 hours after online publication and is updated daily on week days.
Initial download of the metrics may take a while.