Open Access
Fig. 5.
Download original image
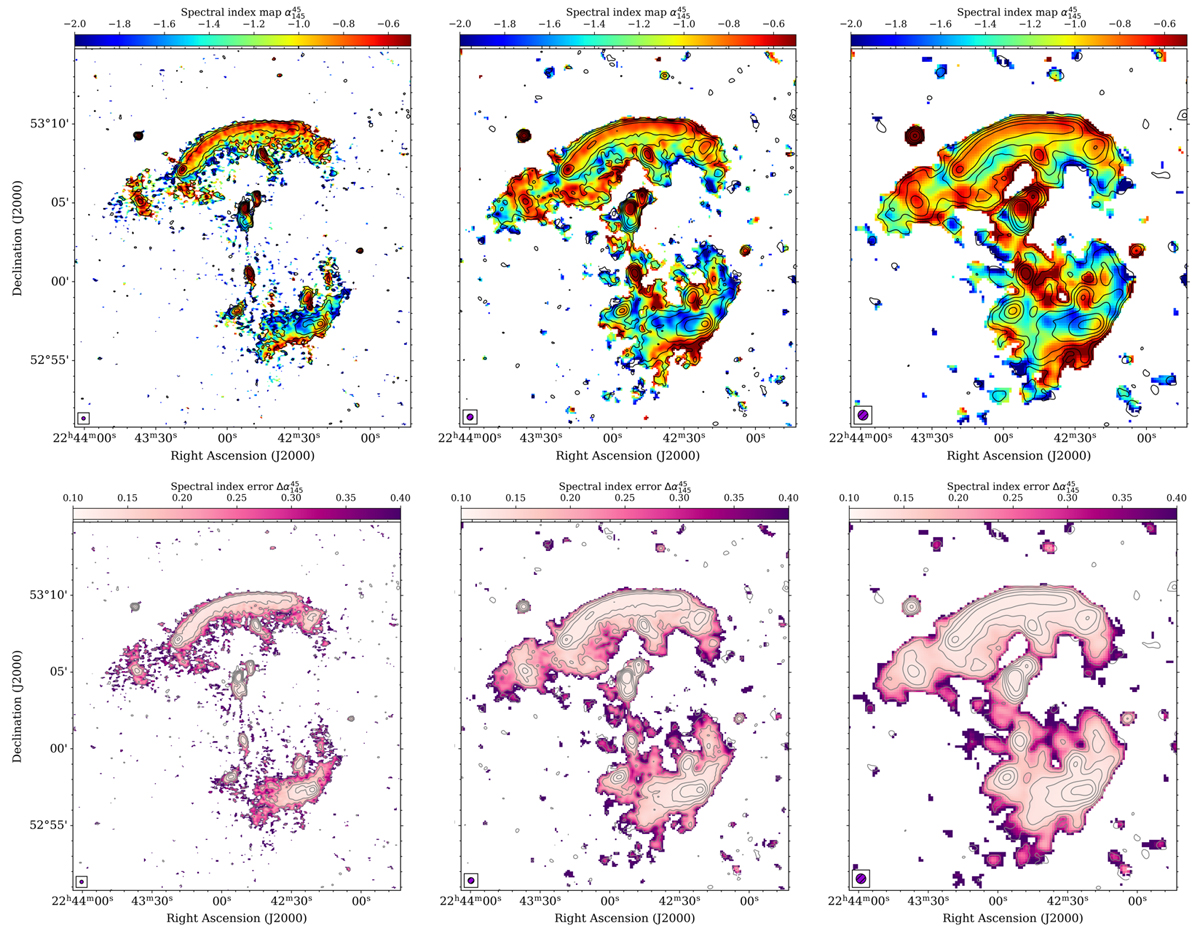
Top panel: spectral index map between 45 and 145 MHz at a spatial resolution of 13″ × 13″ (left), 23″ × 23″ (middle) and 37″ × 37″ (right). Bottom panel: relative spectral index error ![]() . Pixels with surface brightness values below 2σrms in the two images were blanked and
. Pixels with surface brightness values below 2σrms in the two images were blanked and ![]() contours are over-plotted.
contours are over-plotted.
Current usage metrics show cumulative count of Article Views (full-text article views including HTML views, PDF and ePub downloads, according to the available data) and Abstracts Views on Vision4Press platform.
Data correspond to usage on the plateform after 2015. The current usage metrics is available 48-96 hours after online publication and is updated daily on week days.
Initial download of the metrics may take a while.