Fig. 2.
Download original image
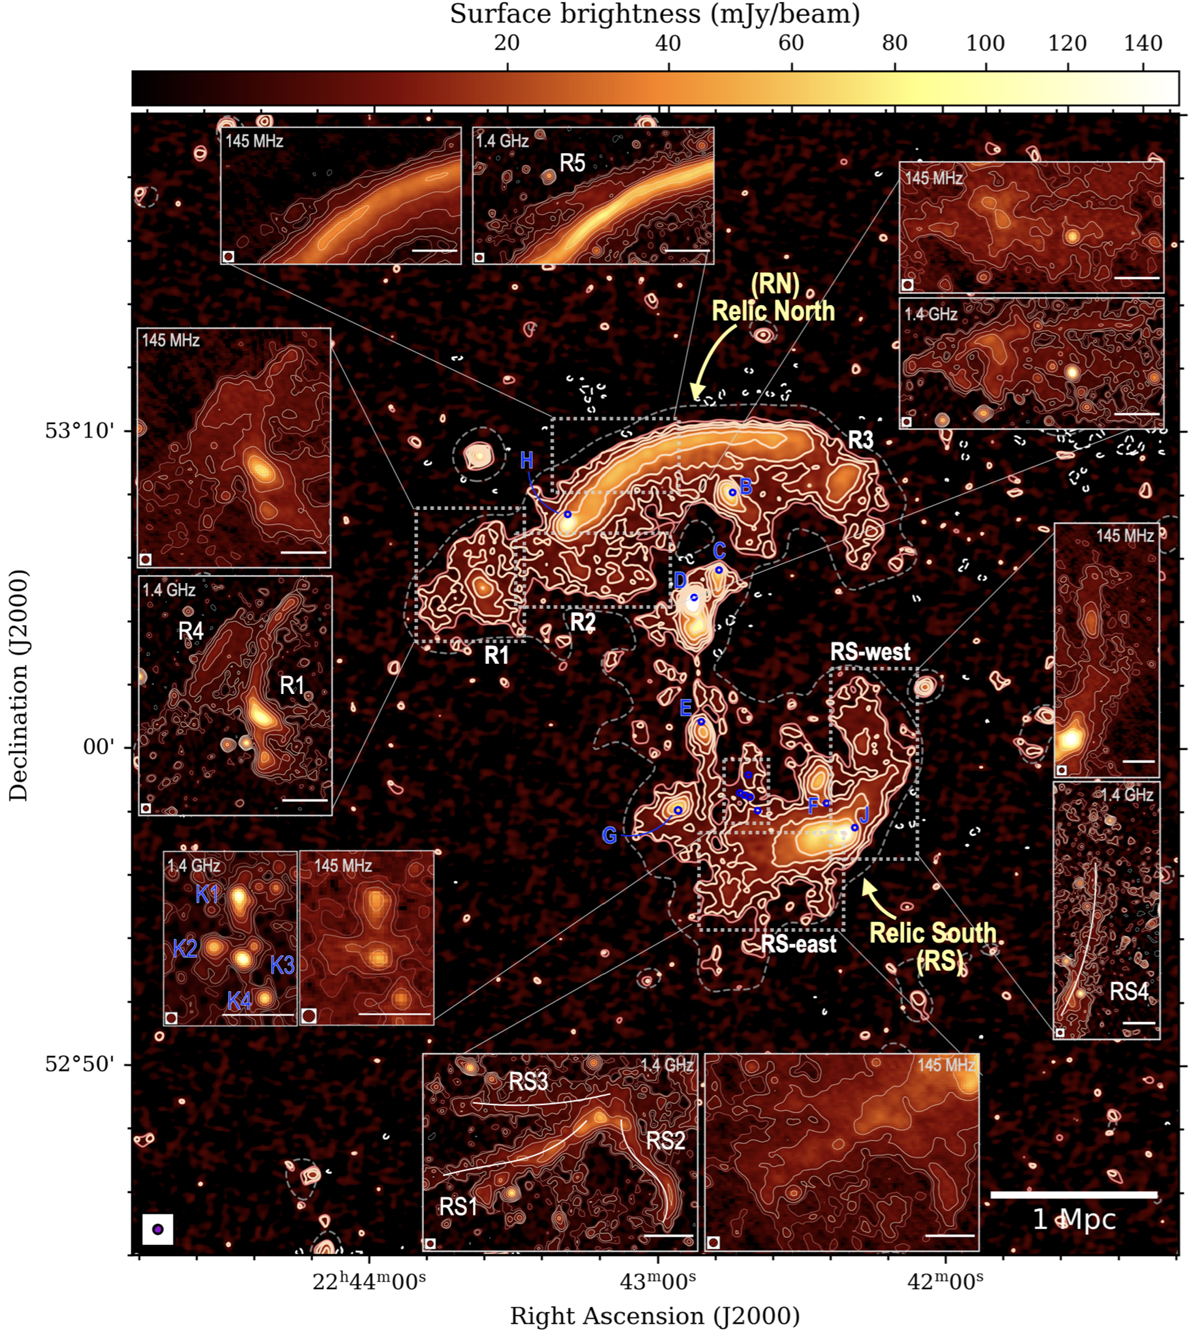
Image of CIZA J2242.8+5301 at 45 MHz, shown at the LBA nominal resolution (15″ beam). The contour levels are ![]() , where
, where ![]() , with additional dashed 3σrms level from 45″ image (Fig. 3, right). Insets show zoomed-in views at different frequencies (1.4 GHz, Di Gennaro et al. 2018 and 145 MHz, Hoang et al. 2017) and comparable resolutions (6″ and 7.5″, respectively) of the main substructures of the galaxy cluster. Contour levels in all panels are drawn at [ − 3, 2, 3, 6, 12, 24, 48, 96]×σrms, with
, with additional dashed 3σrms level from 45″ image (Fig. 3, right). Insets show zoomed-in views at different frequencies (1.4 GHz, Di Gennaro et al. 2018 and 145 MHz, Hoang et al. 2017) and comparable resolutions (6″ and 7.5″, respectively) of the main substructures of the galaxy cluster. Contour levels in all panels are drawn at [ − 3, 2, 3, 6, 12, 24, 48, 96]×σrms, with ![]() and
and ![]() . The scale bar at the bottom right of each sub-plot corresponds to 150 kpc. Source labels are adapted from previous studies (e.g. Stroe et al. 2013; Hoang et al. 2017; Di Gennaro et al. 2018).
. The scale bar at the bottom right of each sub-plot corresponds to 150 kpc. Source labels are adapted from previous studies (e.g. Stroe et al. 2013; Hoang et al. 2017; Di Gennaro et al. 2018).
Current usage metrics show cumulative count of Article Views (full-text article views including HTML views, PDF and ePub downloads, according to the available data) and Abstracts Views on Vision4Press platform.
Data correspond to usage on the plateform after 2015. The current usage metrics is available 48-96 hours after online publication and is updated daily on week days.
Initial download of the metrics may take a while.