Open Access
Fig. 11.
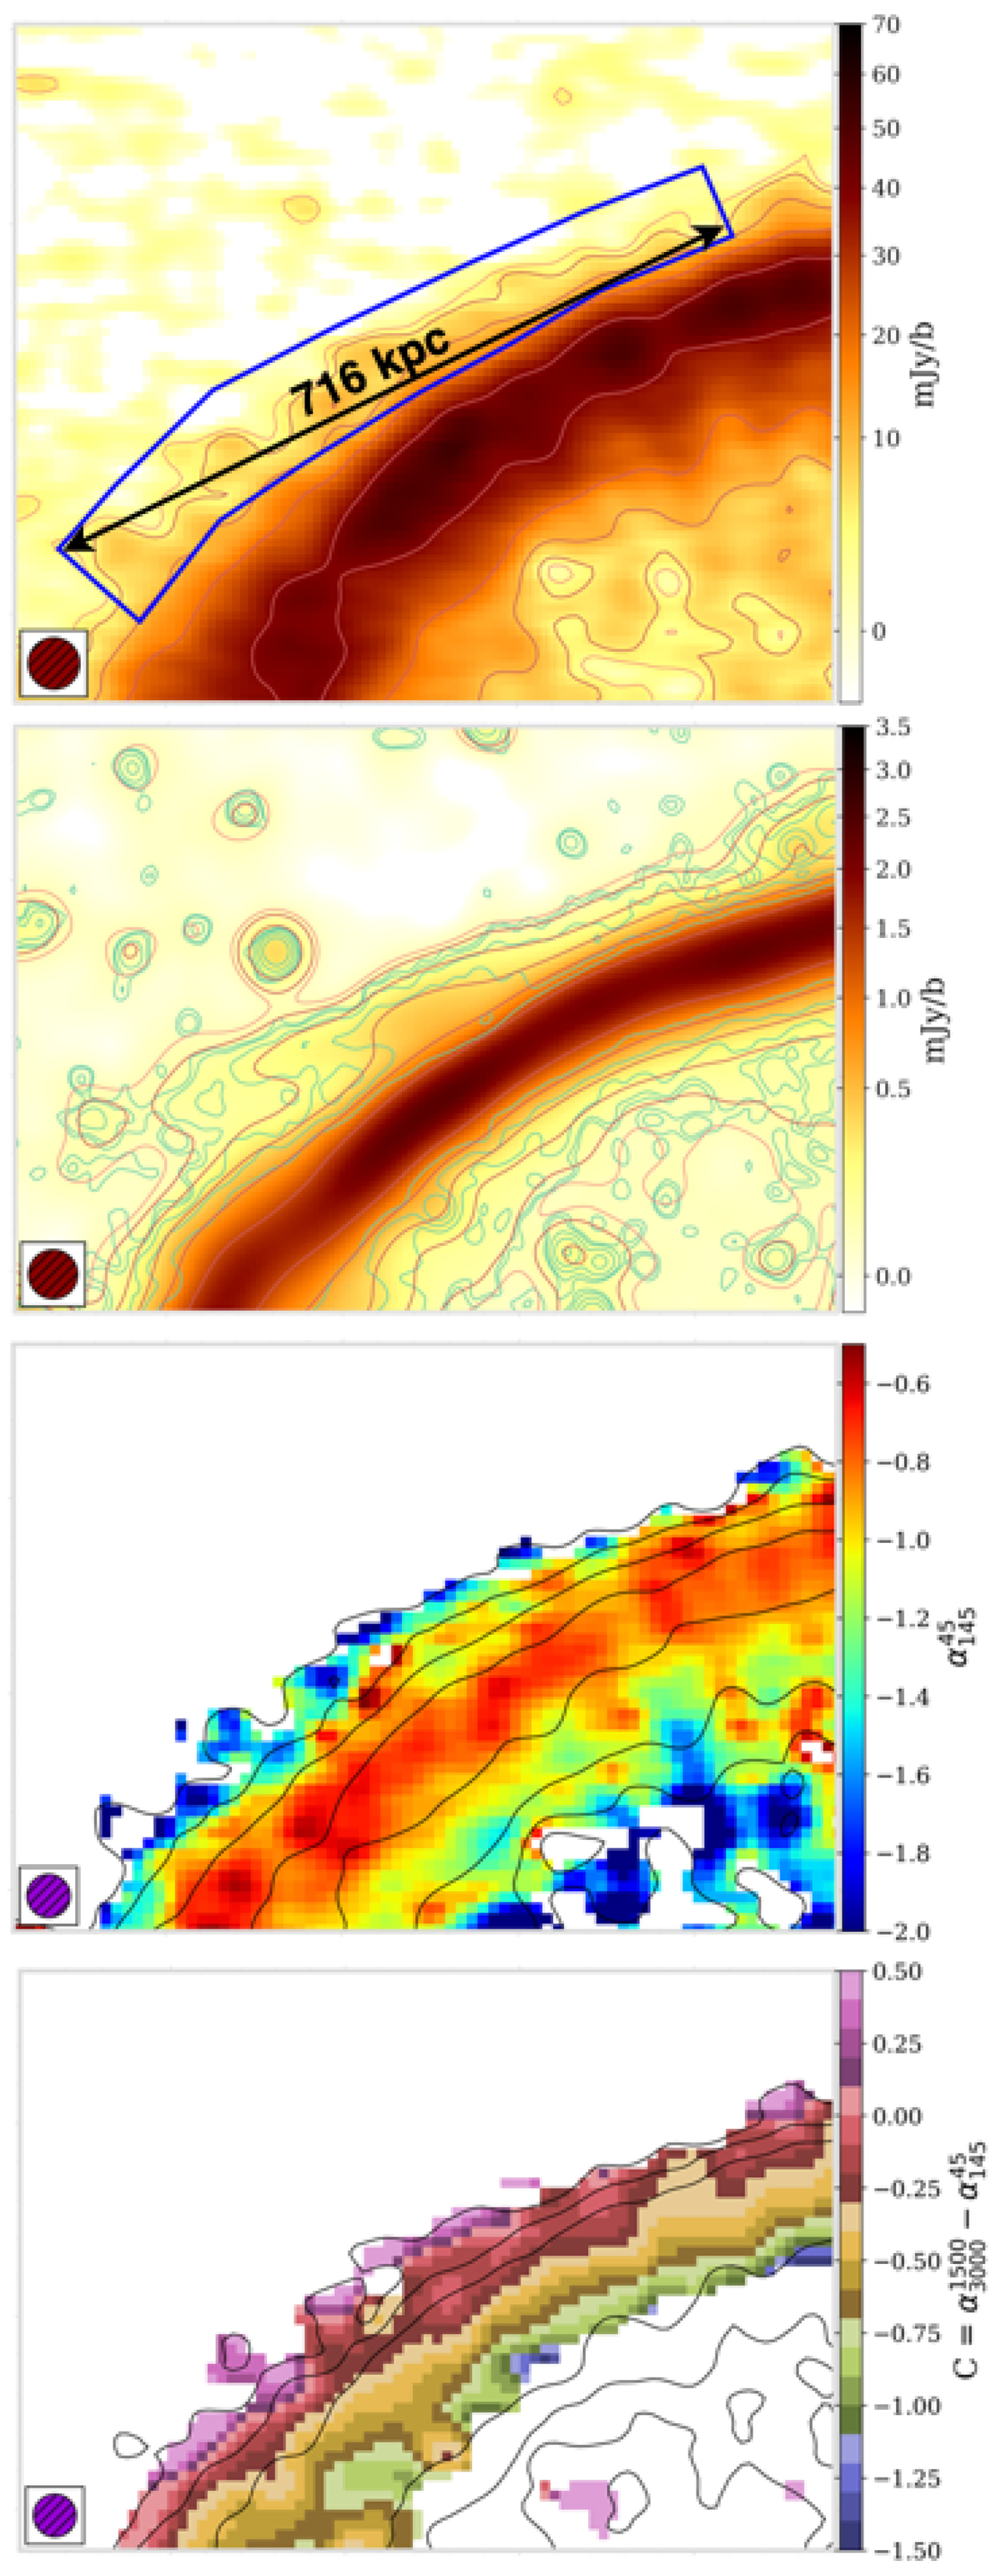
Download original image
Zoom-in on the R5 emission regio. From top to bottom: 45 MHz image at 15″ resolution; 1.5 GHz image convolved to the same 15″ resolution and green contours indicating the 5″ higher resolution data; spectral index map between 45 and 145 MHz from Fig. 5, 4-frequency (45, 145, 1500, 3000 MHz) curvature map from Fig. 6.
Current usage metrics show cumulative count of Article Views (full-text article views including HTML views, PDF and ePub downloads, according to the available data) and Abstracts Views on Vision4Press platform.
Data correspond to usage on the plateform after 2015. The current usage metrics is available 48-96 hours after online publication and is updated daily on week days.
Initial download of the metrics may take a while.