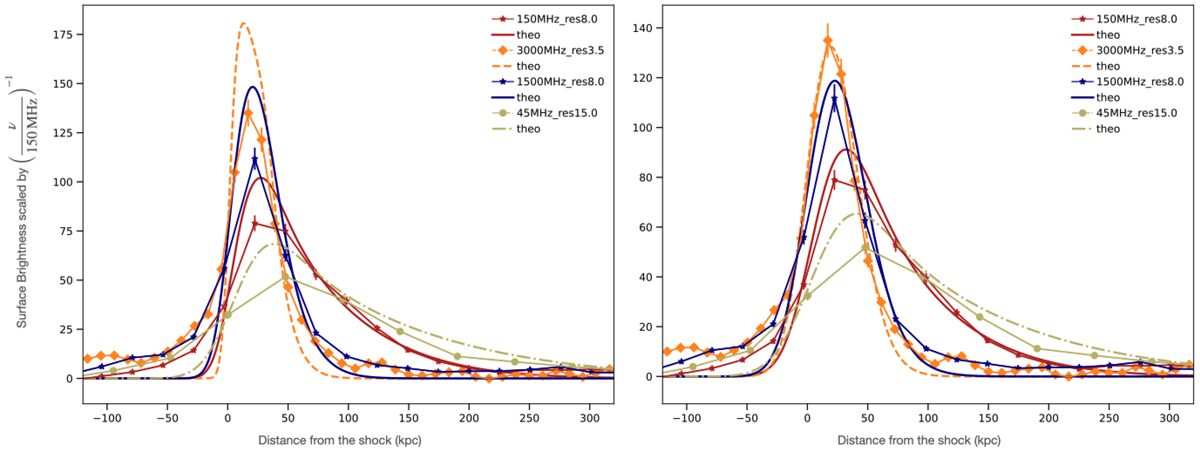
Fig. 10.
Download original image
Surface brightness profile across the western half of RN. We applied the model to different frequencies at different resolutions: 3 GHz at 3.5″ (orange), 1.5 GHz at 8″ (blue), 150 MHz at 8″ (red), and 45 MHz at 15″. Left: log-normal magnetic field distribution (B0 = 0.3 μG, log(σ) = 1.65) and Ψ = 12° projection. Right: log-normal magnetic field distribution (B0 = 0.3 μG, log(σ) = 1.65), Ψ = 12° projection and additional wiggle-effect with σ = 15 kpc.
Current usage metrics show cumulative count of Article Views (full-text article views including HTML views, PDF and ePub downloads, according to the available data) and Abstracts Views on Vision4Press platform.
Data correspond to usage on the plateform after 2015. The current usage metrics is available 48-96 hours after online publication and is updated daily on week days.
Initial download of the metrics may take a while.