Fig. 6
Download original image
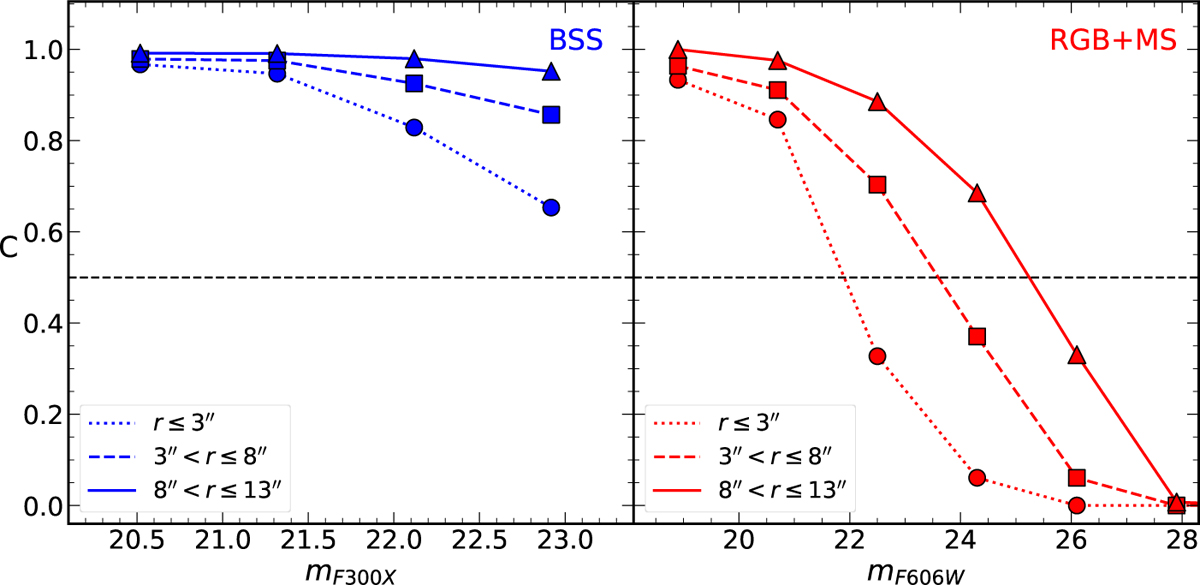
Completeness curves of the BSS and RGB+MS populations as a function of the mF300X and the mF606W magnitudes (left and right panels, respectively). The dotted, dashed, and solid lines correspond respectively to the innermost (r < 3′′), intermediate (3′′ < r < 8′′), and outermost (r > 8′′) radial bins considered in the analysis.
Current usage metrics show cumulative count of Article Views (full-text article views including HTML views, PDF and ePub downloads, according to the available data) and Abstracts Views on Vision4Press platform.
Data correspond to usage on the plateform after 2015. The current usage metrics is available 48-96 hours after online publication and is updated daily on week days.
Initial download of the metrics may take a while.