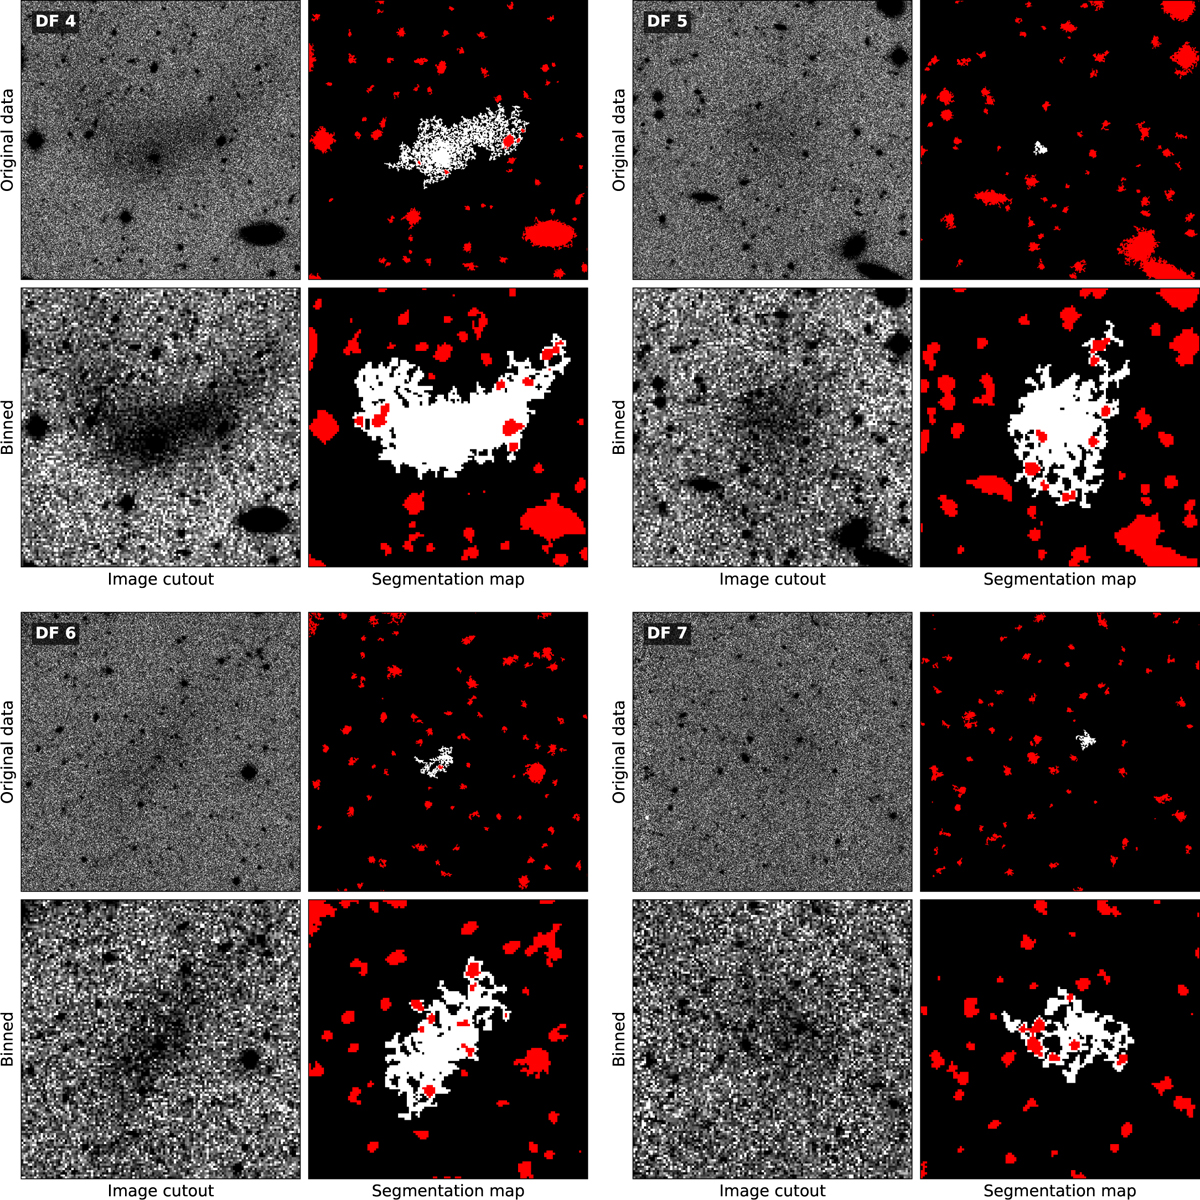
Fig. A.1
Download original image
Detectability of four UDGs detected around NGC 5485 in Merritt et al. (2014) before and after 4 × 4 binning. Each quadrant presents one source with four panels arranged as follows: original data (upper left) with its corresponding segmentation map (upper right), and 4 × 4 binned data (lower left) with its corresponding segmentation map (lower right). The segmentation map shows the UDG segment in white and all other sources in red.
Current usage metrics show cumulative count of Article Views (full-text article views including HTML views, PDF and ePub downloads, according to the available data) and Abstracts Views on Vision4Press platform.
Data correspond to usage on the plateform after 2015. The current usage metrics is available 48-96 hours after online publication and is updated daily on week days.
Initial download of the metrics may take a while.