Fig. 8
Download original image
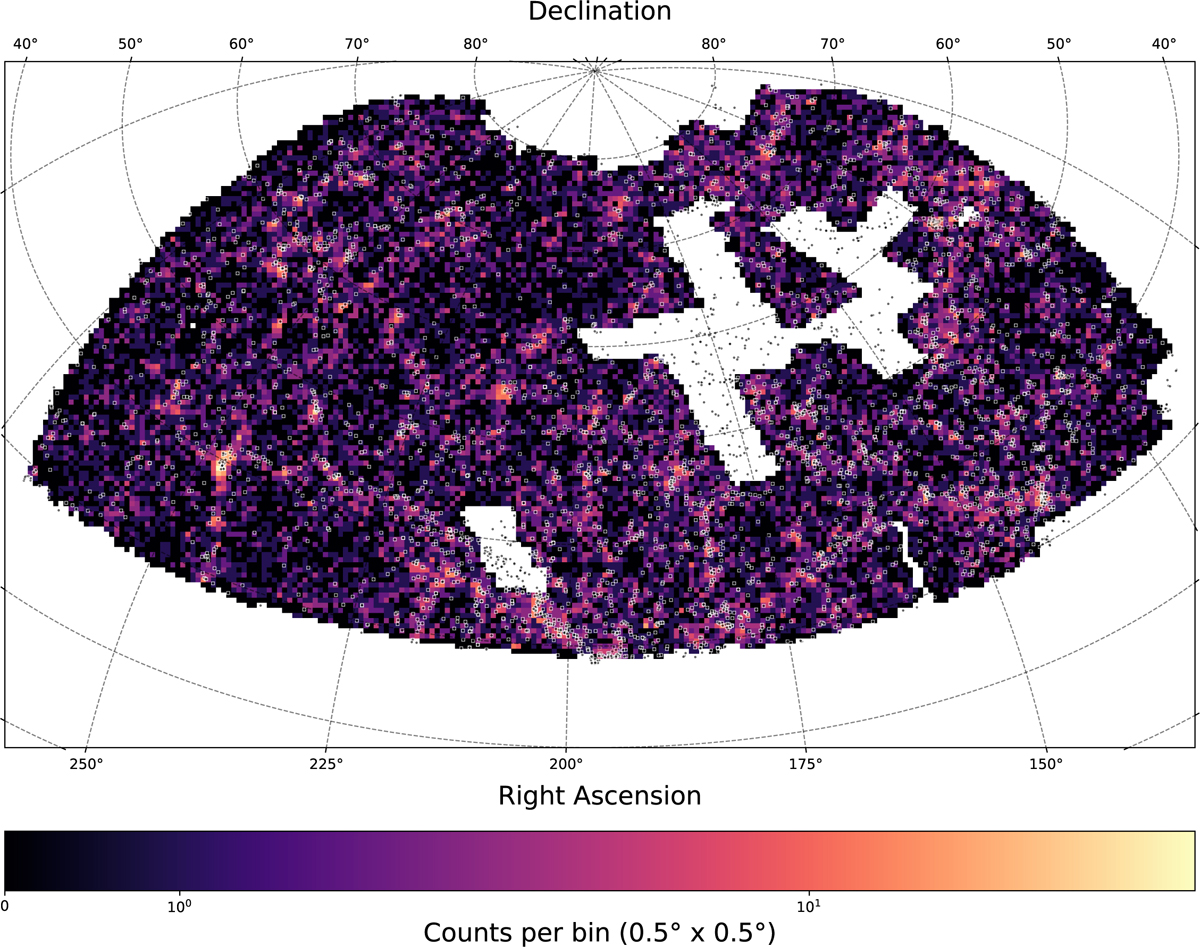
Distribution of high-confidence dwarf galaxy candidates (prediction score >0.9) from the GOBLIN catalog on a Lambert azimuthal equalarea projection. Each pixel (or bin) represents an equal size of 0.5 × 0.5 degrees, regardless of the location on the map. Black dots with white outlines show massive galaxies up to 120 Mpc with stellar masses log (M∗/M⊙)≥ 10. The color bar shows counts per bin on a logarithmic scale. Colored areas show survey coverage in g, r, and i.
Current usage metrics show cumulative count of Article Views (full-text article views including HTML views, PDF and ePub downloads, according to the available data) and Abstracts Views on Vision4Press platform.
Data correspond to usage on the plateform after 2015. The current usage metrics is available 48-96 hours after online publication and is updated daily on week days.
Initial download of the metrics may take a while.