Fig. 4
Download original image
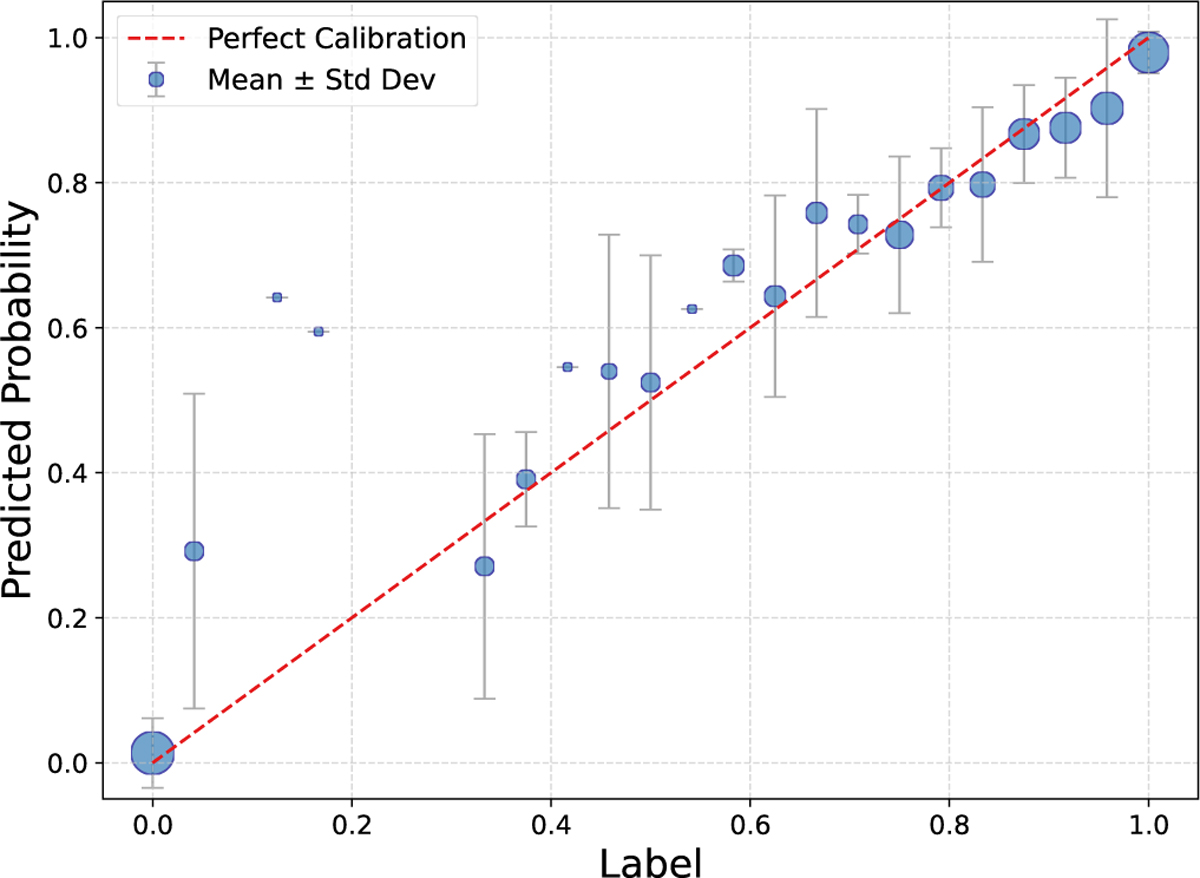
Prediction vs label performance of the network on the test set consisting of 347 objects. On the x-axis, we show the 21 soft labels from our visual classification. On the y-axis, we show the mean predictions of the model in the 21 soft-label bins. The data point size reflects the number of examples in each bin, with the smallest points (e.g., two points between 0.1 and 0.2), representing bins containing only a single data point. Error bars represent the standard deviation of predictions within each bin. We assumed a Gaussian distribution to compute the mean and standard deviation. The red dashed line shows the one-to-one relation, indicating ideal calibration.
Current usage metrics show cumulative count of Article Views (full-text article views including HTML views, PDF and ePub downloads, according to the available data) and Abstracts Views on Vision4Press platform.
Data correspond to usage on the plateform after 2015. The current usage metrics is available 48-96 hours after online publication and is updated daily on week days.
Initial download of the metrics may take a while.