Fig. 2
Download original image
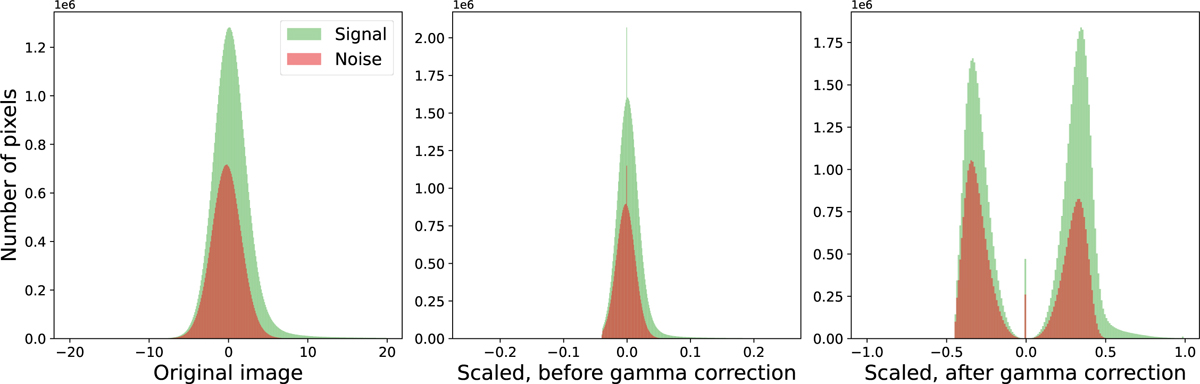
Pixel value distribution in the r band for different stages of processing. Left: flux distribution in the original image tile. Middle: data after scaling via the inverse hyperbolic sine function. Right: bimodal distribution of the scaled data after gamma correction. Pixel values attributed to the signal (astronomical objects) are shown in green and the ones coming from areas devoid of objects (background noise) are shown in red.
Current usage metrics show cumulative count of Article Views (full-text article views including HTML views, PDF and ePub downloads, according to the available data) and Abstracts Views on Vision4Press platform.
Data correspond to usage on the plateform after 2015. The current usage metrics is available 48-96 hours after online publication and is updated daily on week days.
Initial download of the metrics may take a while.