Fig. E.2
Download original image
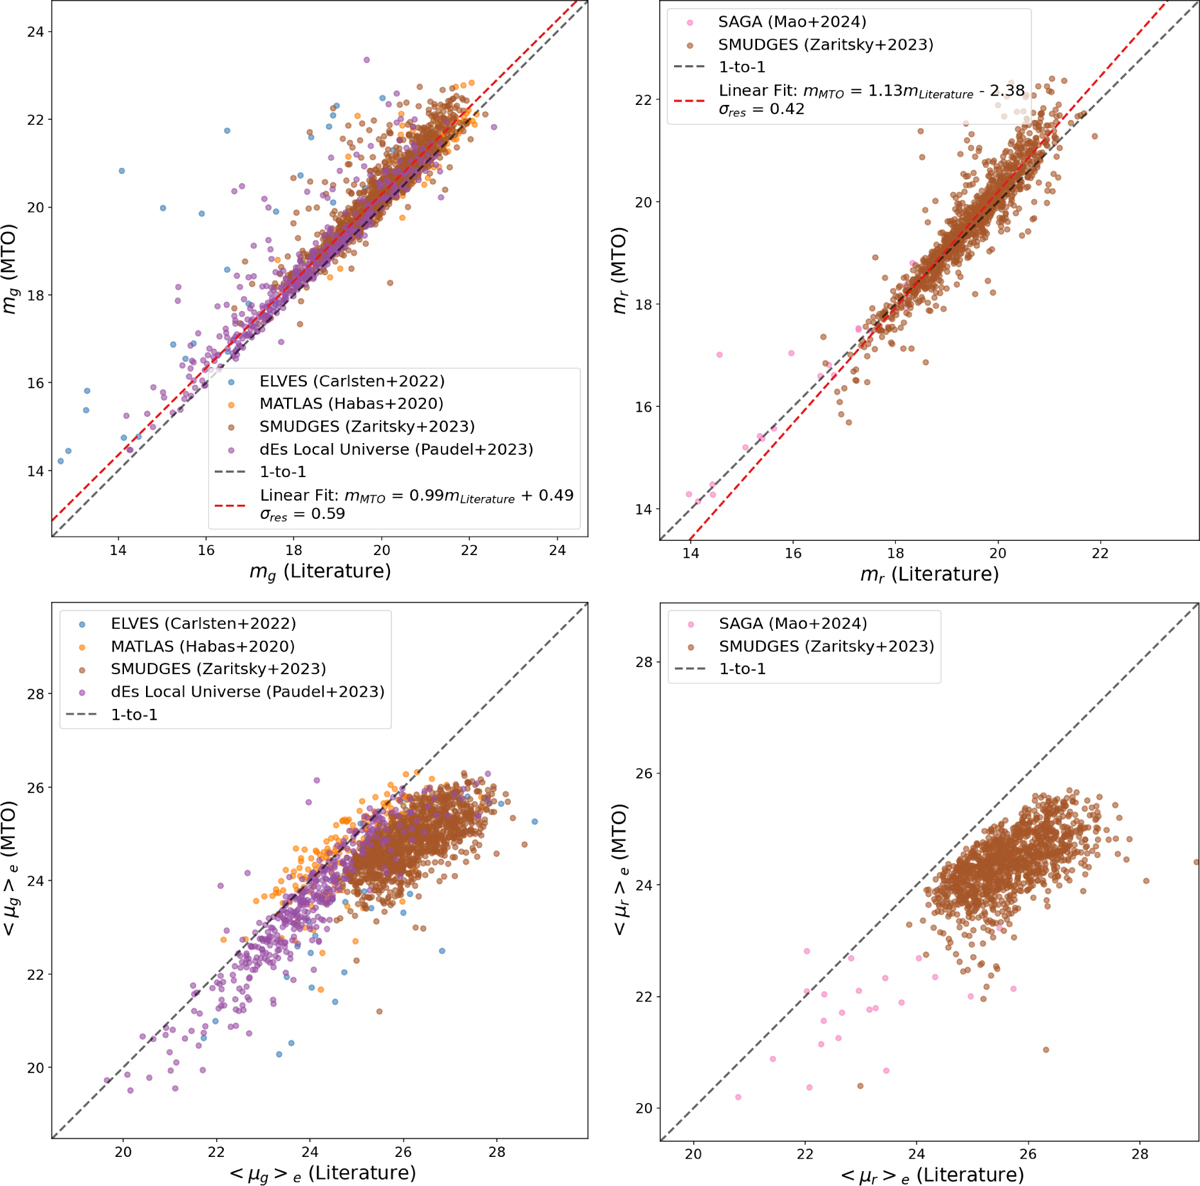
Comparison between the apparent magnitudes, m (top row) and the mean effective surface brightnesses, < μ >e (bottom row) derived from the MTO measurements and the values reported in the literature for the dwarf candidates we used to train our model. We show the literature values on the x-axis and the values measured by MTO on the y-axis. The data points are color coded by the survey they were identified in as shown in the figure legends. The one-to-one relation is plotted as the gray dashed line. The red dashed line in the top row plots shows a linear fit to the data that can be used to correct the magnitude offset from the one-to-one relation. We report the standard deviation of the residuals with respect to this linear fit σres in the legend. Left column: g band, right column: r band.
Current usage metrics show cumulative count of Article Views (full-text article views including HTML views, PDF and ePub downloads, according to the available data) and Abstracts Views on Vision4Press platform.
Data correspond to usage on the plateform after 2015. The current usage metrics is available 48-96 hours after online publication and is updated daily on week days.
Initial download of the metrics may take a while.