Fig. C.1
Download original image
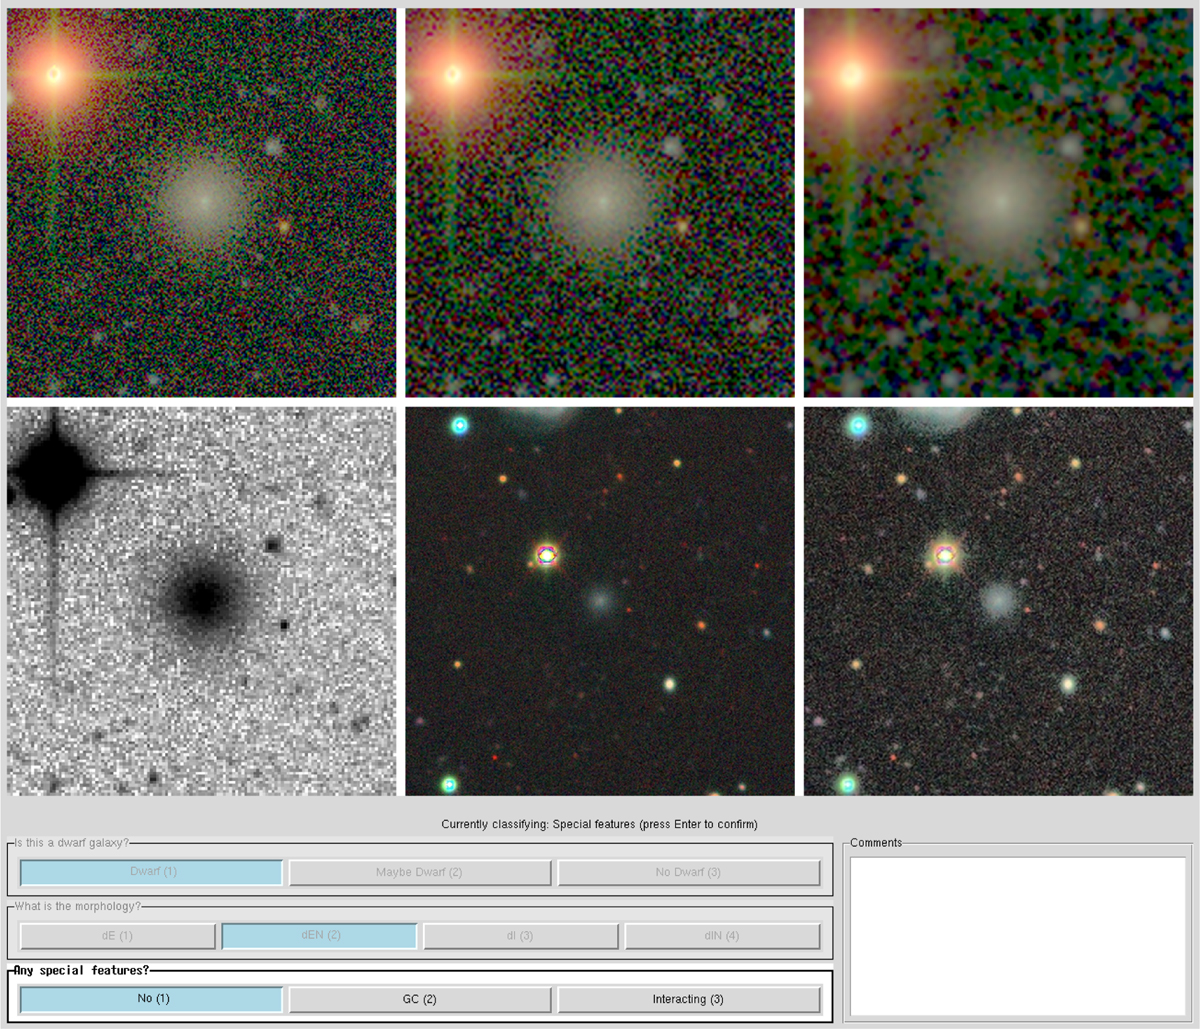
Classification tool used to label our training data. The UI shows six different views of the same object. Top-left: Full resolution RGB image cutout, top-center: 2 × 2 binned RGB cutout, top-right: 2 × 2 binned and smoothed RGB cutout. Bottom-left: r band image cutout. Bottom-center: Legacy Survey cutout. Bottom-right: 2 × 2 binned and CLAHE enhanced Legacy Survey cutout. The tool asks the questions: 1) Is this a dwarf galaxy? If yes or maybe: 2) What is the morphology? and 3) Any special feature? Finally, a comment box is available to note any additional features.
Current usage metrics show cumulative count of Article Views (full-text article views including HTML views, PDF and ePub downloads, according to the available data) and Abstracts Views on Vision4Press platform.
Data correspond to usage on the plateform after 2015. The current usage metrics is available 48-96 hours after online publication and is updated daily on week days.
Initial download of the metrics may take a while.