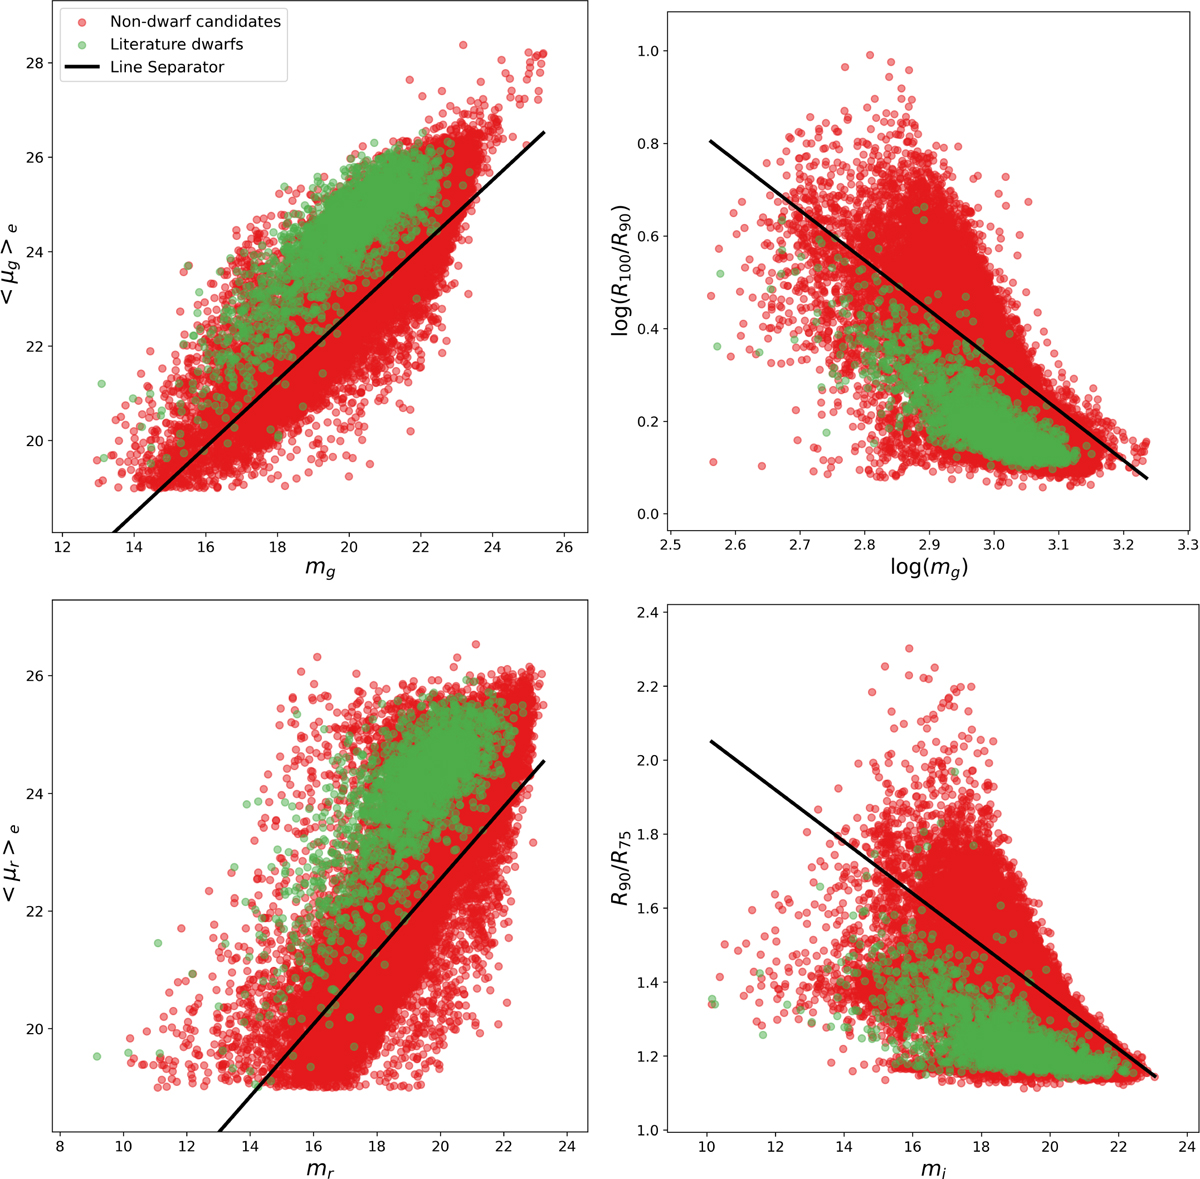
Fig. B.1
Download original image
Examples of parameter spaces used to filter dwarf galaxy candidates. These four panels show the clearest separations we could empirically determine for our data between known dwarf galaxies from the literature (green points) and their nearest neighbors assumed to be non-dwarfs (red points). Top-left: Mean effective surface brightness, < μg >e vs. apparent magnitude, mg in the g band. Top-right: log(R100/R90) vs. log(mg) in the g band. Bottom-left: Mean effective surface brightness, < μr >e vs. mr in the r band. Bottom-right: R90/R75 vs. mi in the i band. The solid black line in each panel indicates the selection boundary we applied to filter out likely non-dwarf objects while preserving the majority of known dwarfs. The lines follow the relations B.5, B.7, B.1, and B.12, respectively.
Current usage metrics show cumulative count of Article Views (full-text article views including HTML views, PDF and ePub downloads, according to the available data) and Abstracts Views on Vision4Press platform.
Data correspond to usage on the plateform after 2015. The current usage metrics is available 48-96 hours after online publication and is updated daily on week days.
Initial download of the metrics may take a while.