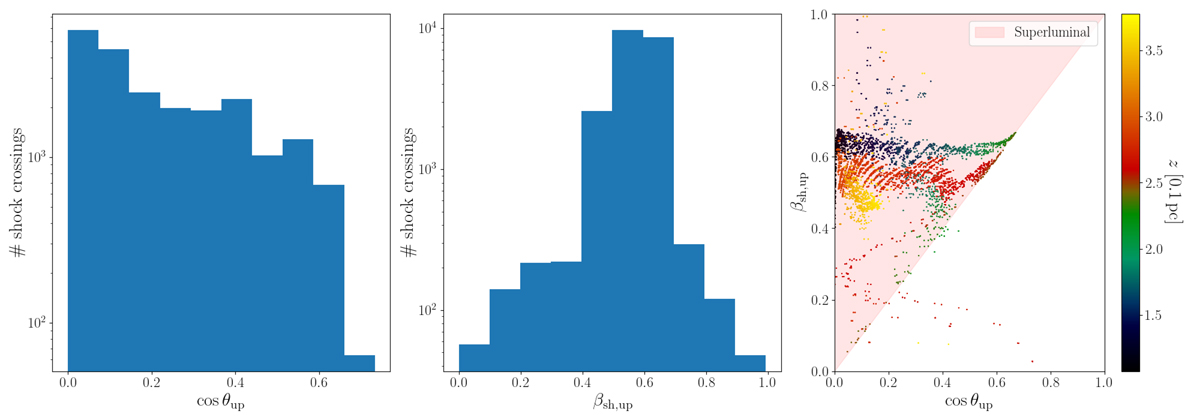
Fig. 3.
Download original image
Left and middle panels: Distribution of the upstream magnetic inclination and shock speed in the upstream rest frame for Simulation A. Right panel: Comparison of these two quantities for each configuration. The dot color indicates the z coordinate of the macroparticle exiting point from the shock. The configurations inside the red region are superluminal.
Current usage metrics show cumulative count of Article Views (full-text article views including HTML views, PDF and ePub downloads, according to the available data) and Abstracts Views on Vision4Press platform.
Data correspond to usage on the plateform after 2015. The current usage metrics is available 48-96 hours after online publication and is updated daily on week days.
Initial download of the metrics may take a while.