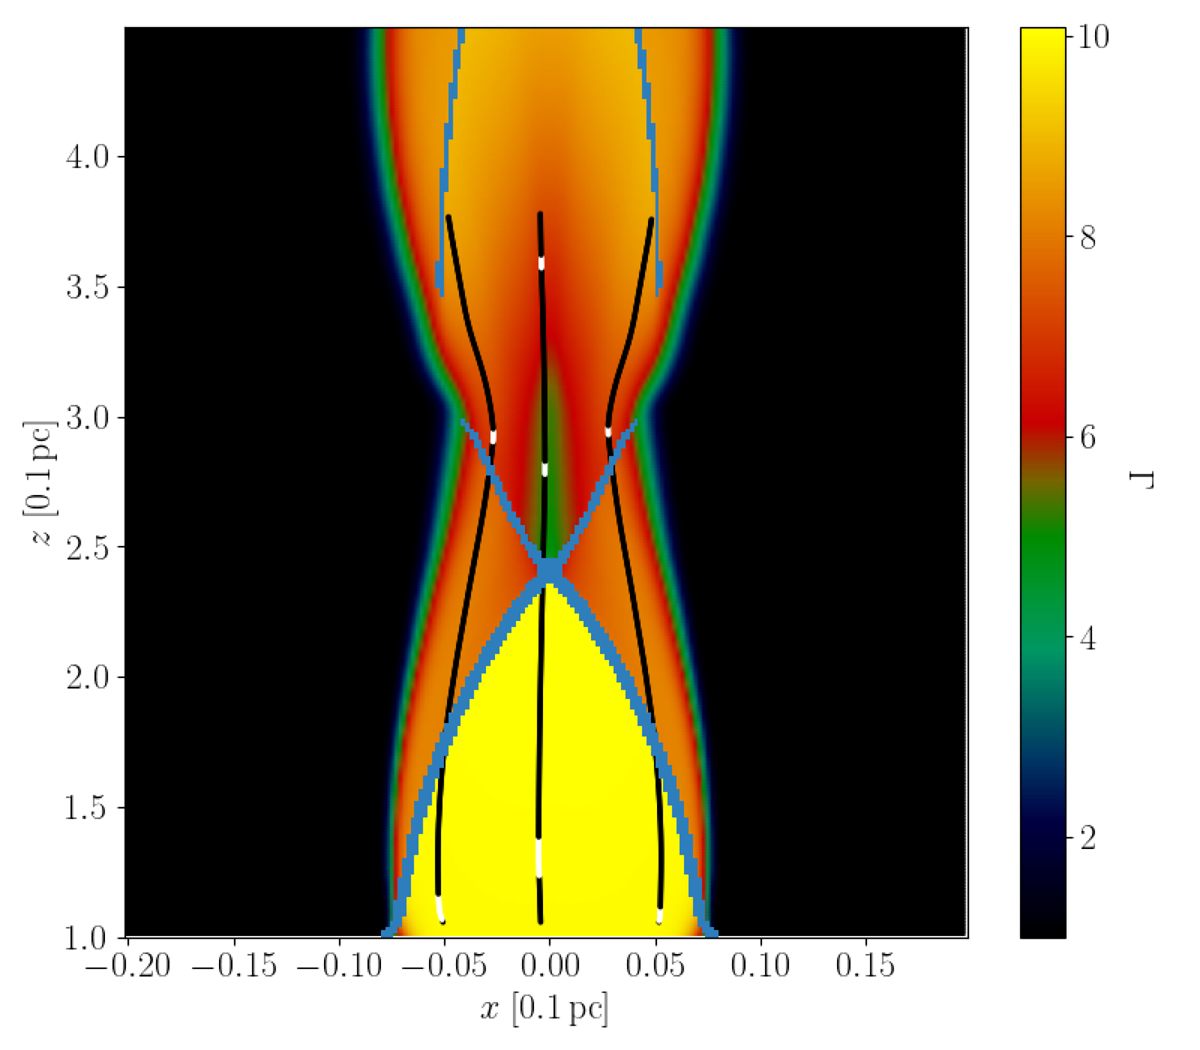
Fig. 2.
Download original image
Map of the Lorentz factor in the xz plane with the projection of the trajectory of 3 macroparticles (number 799, 3983, 7789, Simulation C). The trajectory color represents the macroparticle status: white when inside a shock region and black when outside. The cells tagged as shock regions in the xz plane are highlighted in light blue.
Current usage metrics show cumulative count of Article Views (full-text article views including HTML views, PDF and ePub downloads, according to the available data) and Abstracts Views on Vision4Press platform.
Data correspond to usage on the plateform after 2015. The current usage metrics is available 48-96 hours after online publication and is updated daily on week days.
Initial download of the metrics may take a while.