Fig. 5
Download original image
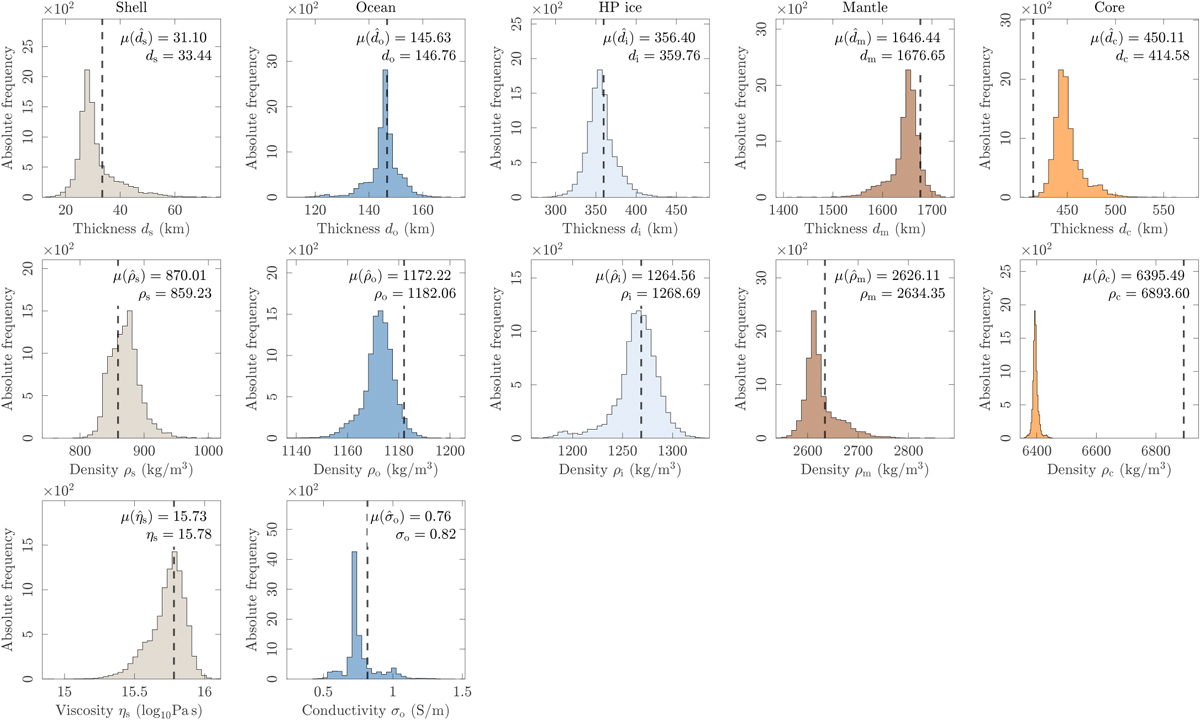
Histograms of the distribution of the interior structure parameters ![]() . These were obtained using the Monte Carlo dropout plus noise starting from the x* set of input parameters shown in Table 3, which was randomly selected from the validation dataset. The mean values,
. These were obtained using the Monte Carlo dropout plus noise starting from the x* set of input parameters shown in Table 3, which was randomly selected from the validation dataset. The mean values, ![]() , and the corresponding true values, y*, are shown in the top-right corner of each subplot. The values of y* are also indicated by dashed vertical lines.
, and the corresponding true values, y*, are shown in the top-right corner of each subplot. The values of y* are also indicated by dashed vertical lines.
Current usage metrics show cumulative count of Article Views (full-text article views including HTML views, PDF and ePub downloads, according to the available data) and Abstracts Views on Vision4Press platform.
Data correspond to usage on the plateform after 2015. The current usage metrics is available 48-96 hours after online publication and is updated daily on week days.
Initial download of the metrics may take a while.