Fig. 3
Download original image
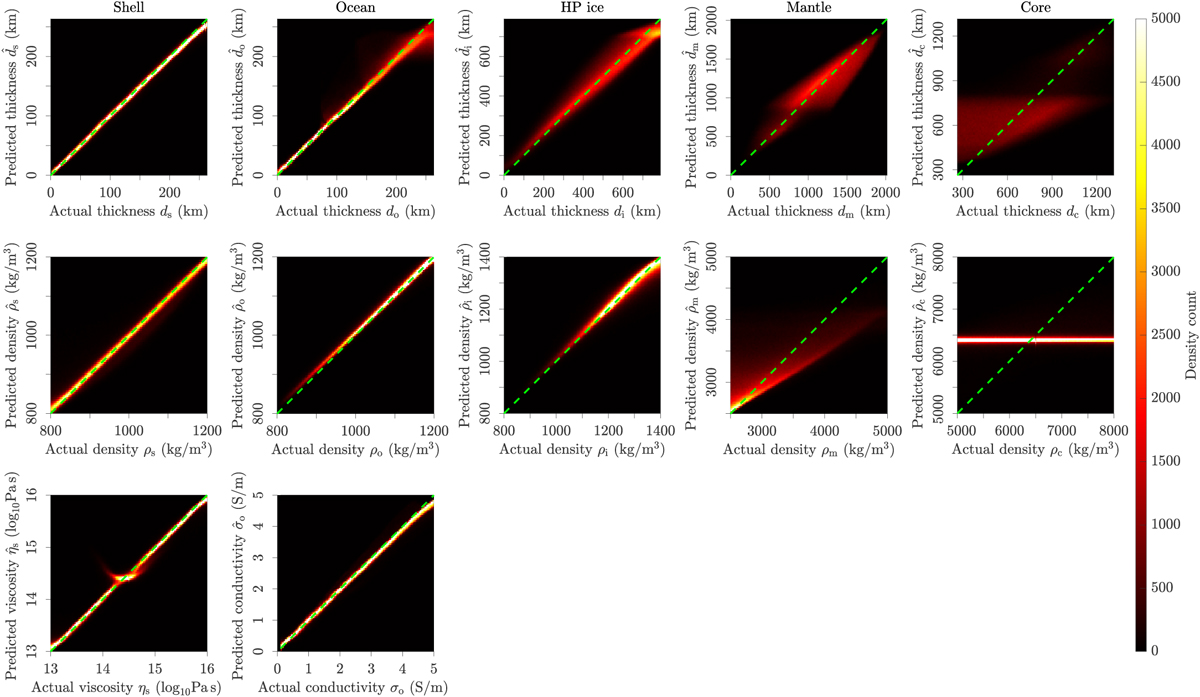
Comparison of the actual values of the interior structure parameters (y) with those predicted by the neural network for the validation dataset ![]() . Each column corresponds to a different layer, with the leftmost column corresponding to the icy shell and the rightmost one to the liquid core. The rows from top to bottom show the results obtained for the thicknesses (dj), for the densities (ρj), and for the icy shell viscosity (ηs) and the ocean conductivity (σo). The dashed green line corresponds to perfect predictions.
. Each column corresponds to a different layer, with the leftmost column corresponding to the icy shell and the rightmost one to the liquid core. The rows from top to bottom show the results obtained for the thicknesses (dj), for the densities (ρj), and for the icy shell viscosity (ηs) and the ocean conductivity (σo). The dashed green line corresponds to perfect predictions.
Current usage metrics show cumulative count of Article Views (full-text article views including HTML views, PDF and ePub downloads, according to the available data) and Abstracts Views on Vision4Press platform.
Data correspond to usage on the plateform after 2015. The current usage metrics is available 48-96 hours after online publication and is updated daily on week days.
Initial download of the metrics may take a while.