Fig. 5
Download original image
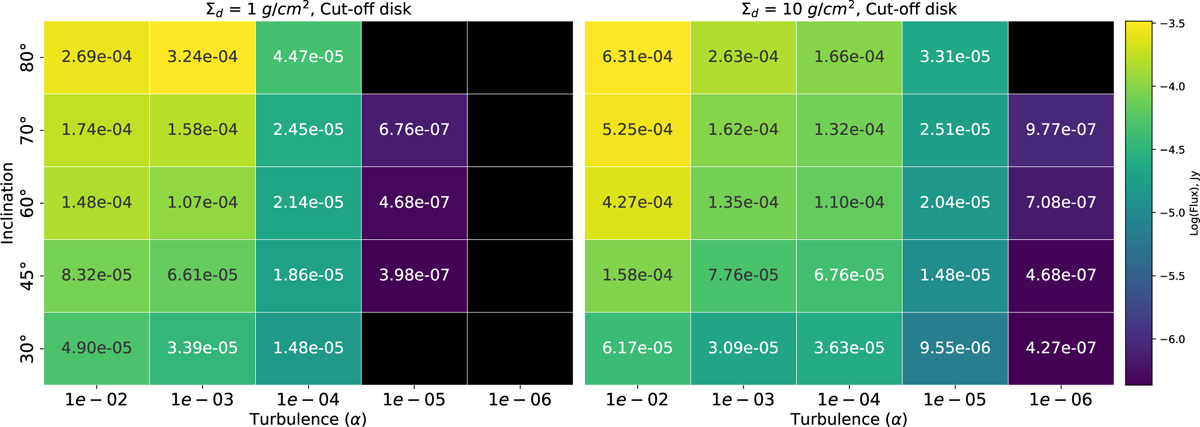
Annotated heat map showing integrated backside flux in parameter studies of cut-off disks. The left panel shows the flux for a surface density Σ0 (dust) fixed at 1 g/cm2 at Rc = 1 AU, while the right panel shows the flux for 10 g/cm2 at Rc = 1 AU. The cells in brighter yellow indicate higher flux, and the cells in darker blue indicate lower flux, with values in jansky. The x-axis represents the Shakura-Sunyaev turbulence parameter (α), and the y-axis represents the inclination angles. Black cells represent disks where the backside could not be detected (absence of secondary peak, refer Figure 3).
Current usage metrics show cumulative count of Article Views (full-text article views including HTML views, PDF and ePub downloads, according to the available data) and Abstracts Views on Vision4Press platform.
Data correspond to usage on the plateform after 2015. The current usage metrics is available 48-96 hours after online publication and is updated daily on week days.
Initial download of the metrics may take a while.