Open Access
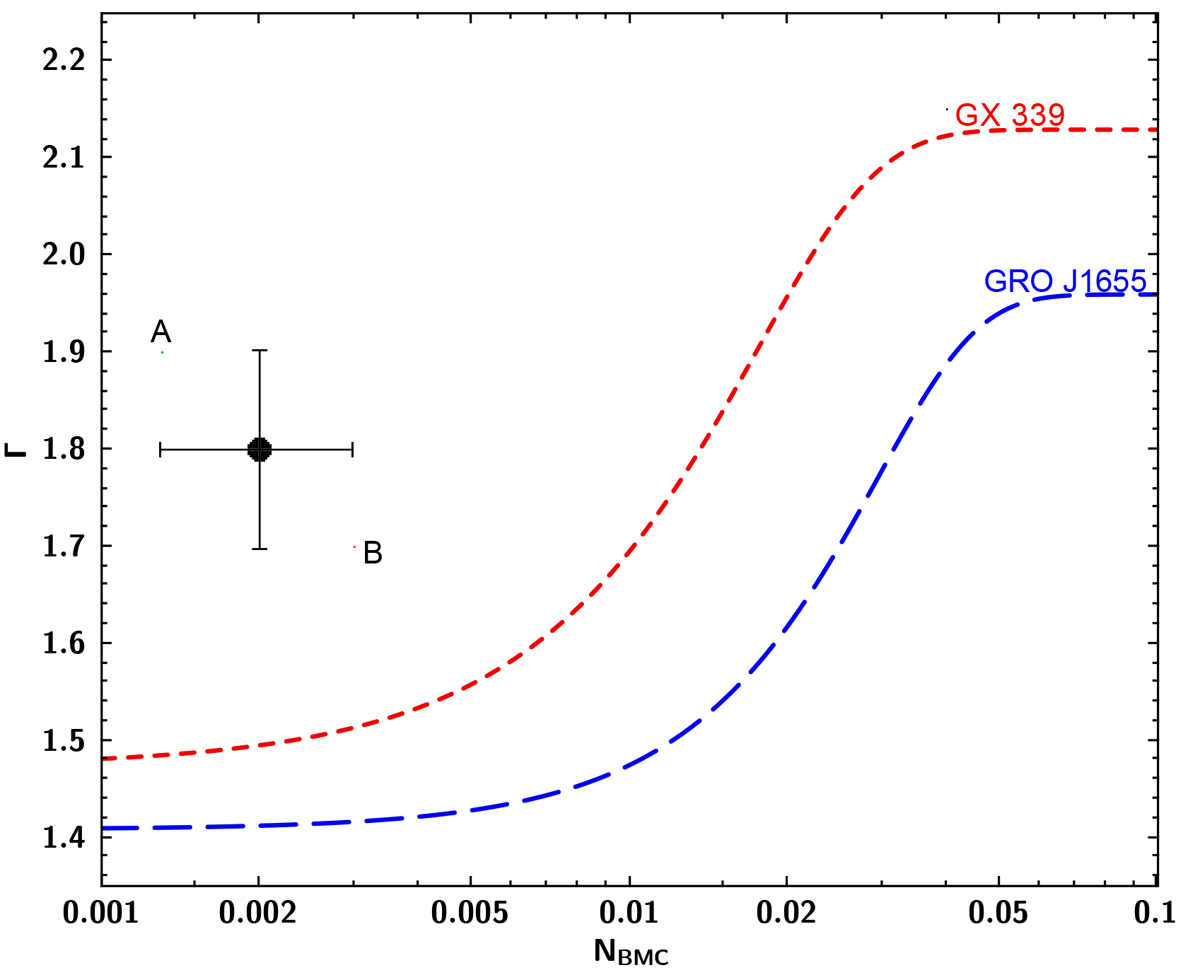
Fig. A.1.
Download original image
Γ - NBMC diagram. The black point represents the AGN with its uncertainties (which have been increased for illustration purposes). The red short-dashed line indicates the spectral trend of the reference source GX 339-4. The blue long-dashed line describes the trend of the reference source GRO J1655-40.
Current usage metrics show cumulative count of Article Views (full-text article views including HTML views, PDF and ePub downloads, according to the available data) and Abstracts Views on Vision4Press platform.
Data correspond to usage on the plateform after 2015. The current usage metrics is available 48-96 hours after online publication and is updated daily on week days.
Initial download of the metrics may take a while.