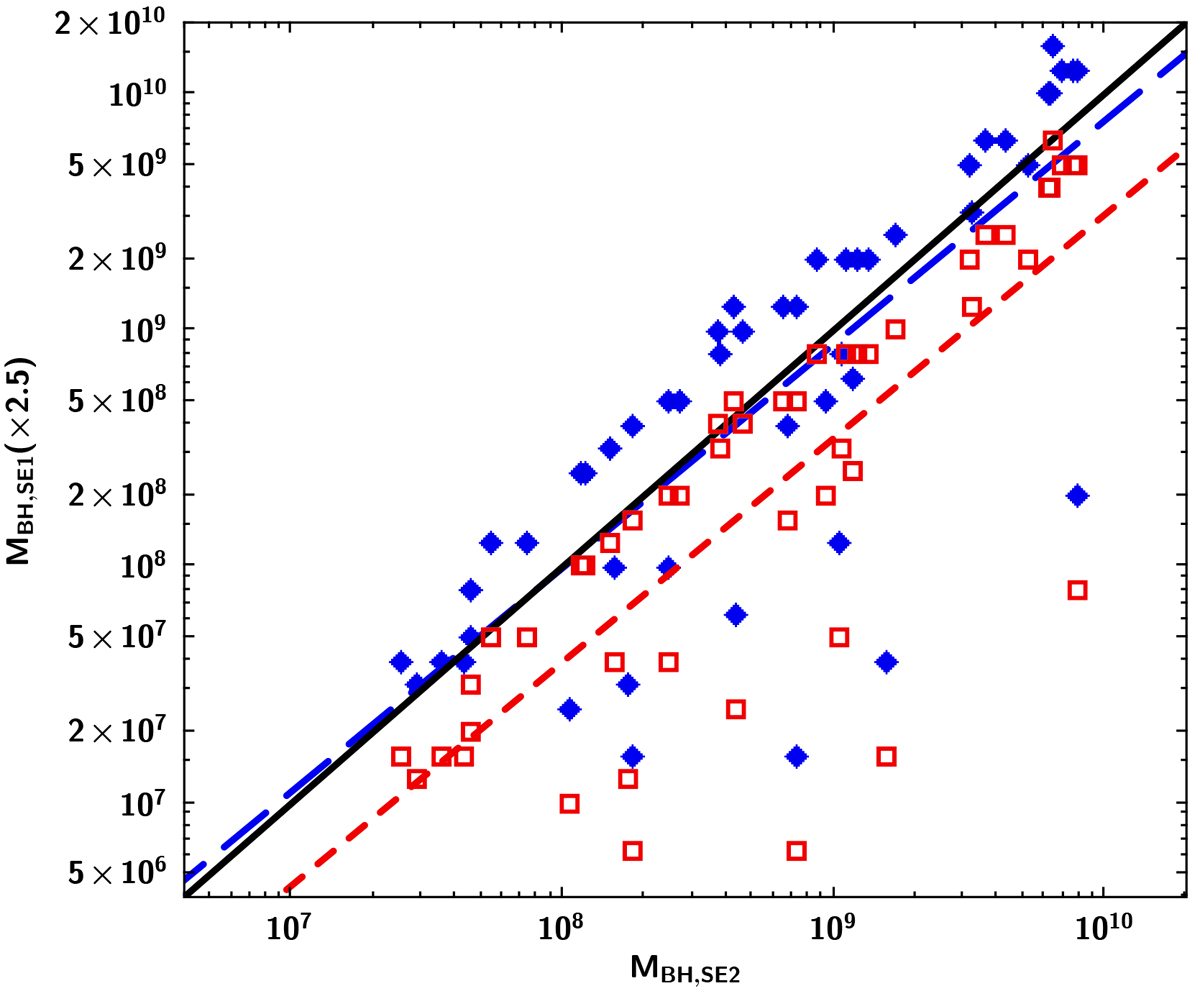
Fig. 3.
Download original image
MBH obtained from the SE method from Rakshit et al. (2020) plotted vs. the corresponding values from Wu & Shen (2022). The open squares are the unshifted values and the red short-dashed line indicates the best linear fit. The blue diamonds represent the Rakshit et al. (2020) shifted by a factor 2.5; in this case the blue long-dashed line, which represents the best linear fit, nearly overlaps the one-to-one correlation illustrated by the continuous black line.
Current usage metrics show cumulative count of Article Views (full-text article views including HTML views, PDF and ePub downloads, according to the available data) and Abstracts Views on Vision4Press platform.
Data correspond to usage on the plateform after 2015. The current usage metrics is available 48-96 hours after online publication and is updated daily on week days.
Initial download of the metrics may take a while.