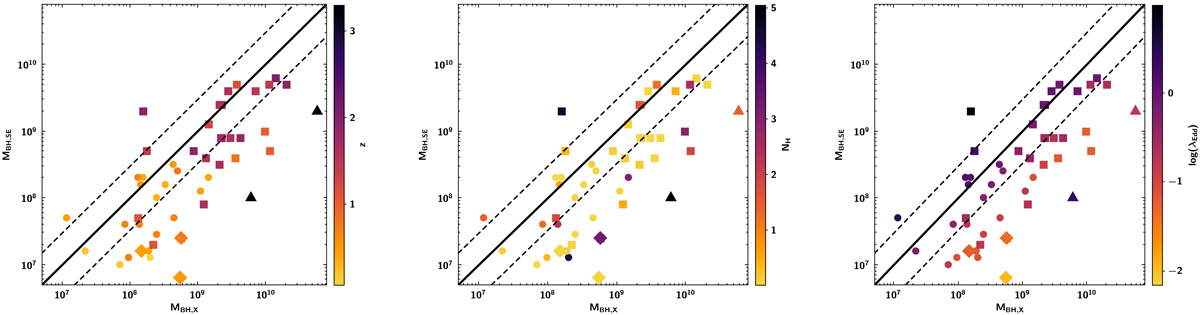
Fig. 2.
Download original image
Left panel: MBH obtained from the SE method using the Hβ line plotted vs. the values derived with the X-ray scaling method, with color-coded symbols indicating the redshift of the sources. Middle panel: Same as the left panel with color-coded symbols illustrating the intrinsic absorption NH in units of 1022 cm−2. Right panel: Same as the left panel with color-coded symbols describing the level of accretion rate, as defined by log(λEdd). Circles indicate MBH based on the Hβ line, squares are values based on the Mg II line, whereas the two triangles indicate the values based on the C IV line; the diamonds represent the sources whose MBH values were flagged as unreliable in Rakshit et al. (2020).
Current usage metrics show cumulative count of Article Views (full-text article views including HTML views, PDF and ePub downloads, according to the available data) and Abstracts Views on Vision4Press platform.
Data correspond to usage on the plateform after 2015. The current usage metrics is available 48-96 hours after online publication and is updated daily on week days.
Initial download of the metrics may take a while.