Fig. 1.
Download original image
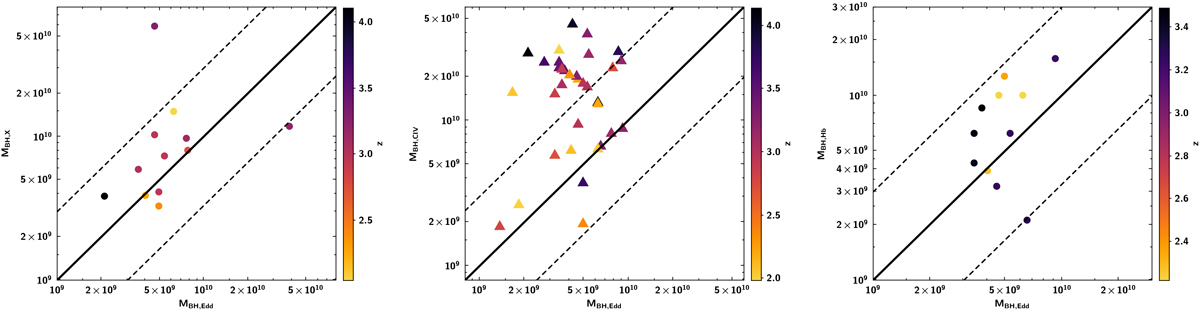
Left panel: MBH obtained with the X-ray scaling method plotted vs. the values corresponding to sources accreting at the Eddington level. Middle panel: MBH obtained with the SE method using the C IV line plotted vs. the Eddington values. Right panel: MBH obtained with the SE method using the Hβ line plotted vs. the Eddington values. The symbols are color coded based on redshift. The continuous black line represents the one-to-one correlation and the dashed lines indicate departures by a factor of 3.
Current usage metrics show cumulative count of Article Views (full-text article views including HTML views, PDF and ePub downloads, according to the available data) and Abstracts Views on Vision4Press platform.
Data correspond to usage on the plateform after 2015. The current usage metrics is available 48-96 hours after online publication and is updated daily on week days.
Initial download of the metrics may take a while.