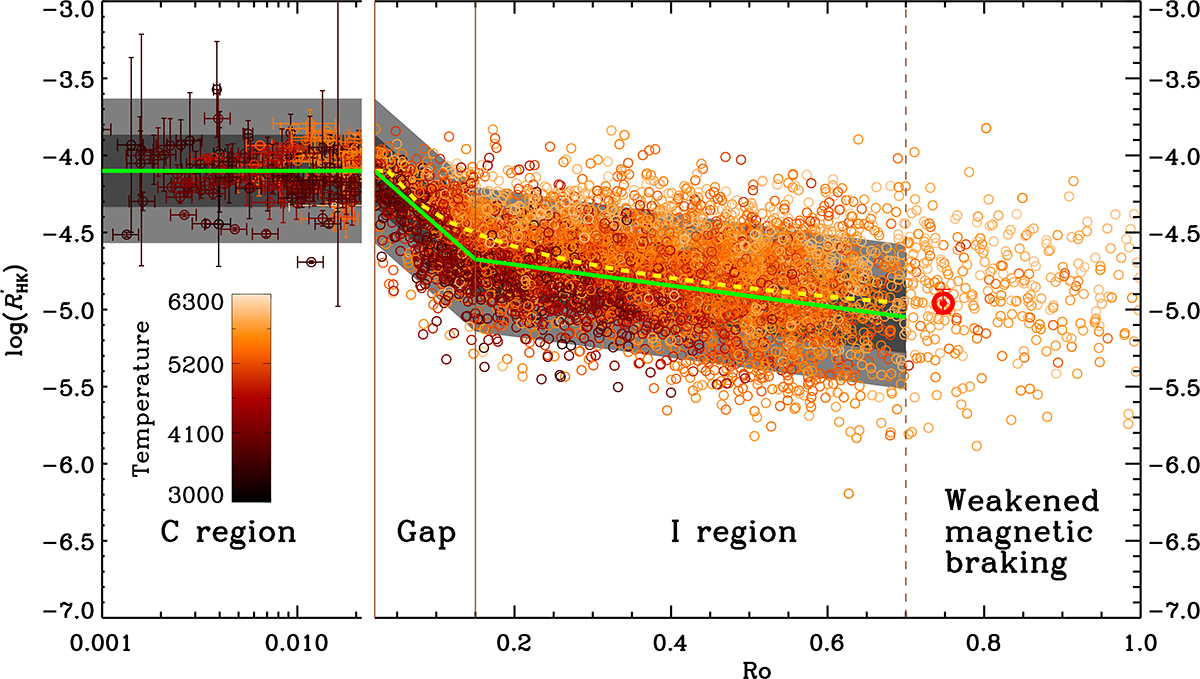
Fig. 9.
Download original image
Rotation–chromospheric activity relation divided into four parts according to the “CgIW” scenario. The solid vertical lines indicate the critical points between the C, gap, and I regions (Ro ≈ 0.022 and Ro ≈ 0.15, respectively). The dashed vertical line marks the transition to the weakened-magnetic-braking phase at Ro≈0.7. The green lines represent the best fit of our proposed model and yellow lines represent the best fit of the dichotomy model. The 1σ scatter and 2σ scatter of the fit are indicated by the shaded gray region. The location of the Sun is marked with an ⊙ symbol. Representative error bars are plotted for the datapoints in the C region.
Current usage metrics show cumulative count of Article Views (full-text article views including HTML views, PDF and ePub downloads, according to the available data) and Abstracts Views on Vision4Press platform.
Data correspond to usage on the plateform after 2015. The current usage metrics is available 48-96 hours after online publication and is updated daily on week days.
Initial download of the metrics may take a while.