Fig. 8.
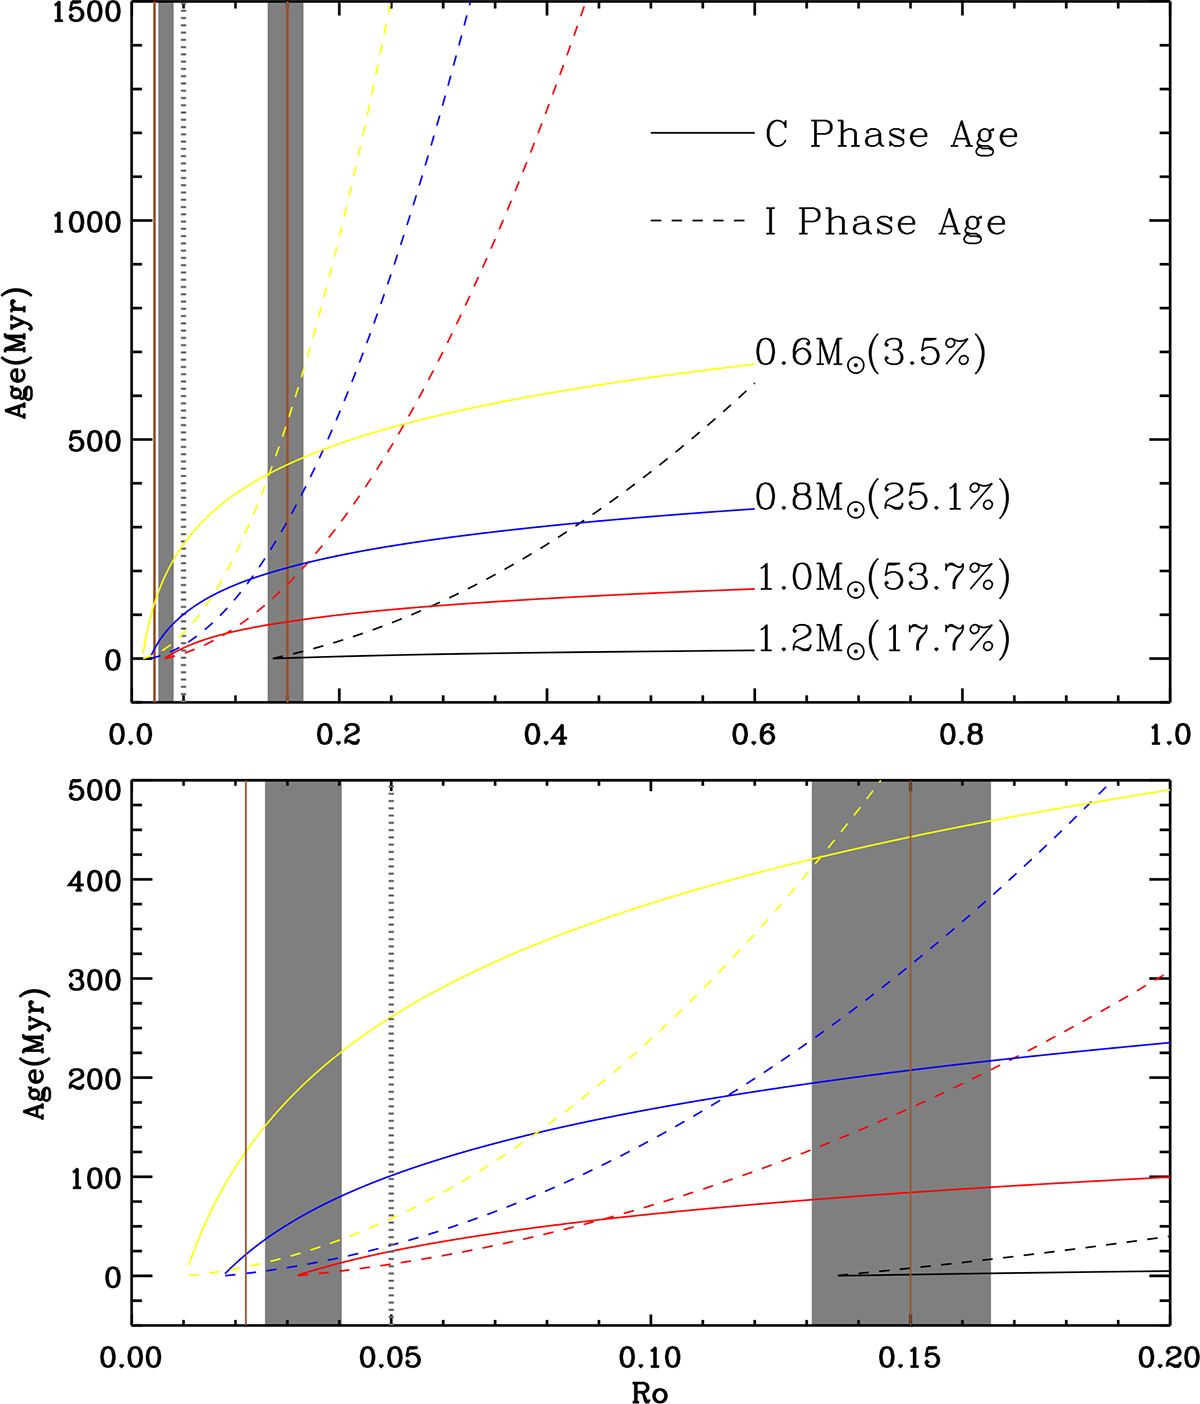
Download original image
Top panel: Rossby number–age relations for 1.2, 1.0, 0.8, and 0.6 solar mass stars. The solid and dashed curves represent the C sequence age and the I sequence age (the first term and the second term of Eq. (5)) respectively. The same color indicates the same stellar mass and the fraction of the sample number is also presented. The vertical brown lines are Rosat = 0.022 and Rog−to−i = 0.15 respectively, separating the C, g and I region. The dotted vertical line is the separating line given by the dichotomy. The shaded region indicates the variation range of the critical Rossby number of the C-to-g and g-to-I transition (see Fig. 11), which depends on stellar mass. Bottom panel: Lower-left region in the top panel.
Current usage metrics show cumulative count of Article Views (full-text article views including HTML views, PDF and ePub downloads, according to the available data) and Abstracts Views on Vision4Press platform.
Data correspond to usage on the plateform after 2015. The current usage metrics is available 48-96 hours after online publication and is updated daily on week days.
Initial download of the metrics may take a while.