Fig. 7.
Download original image
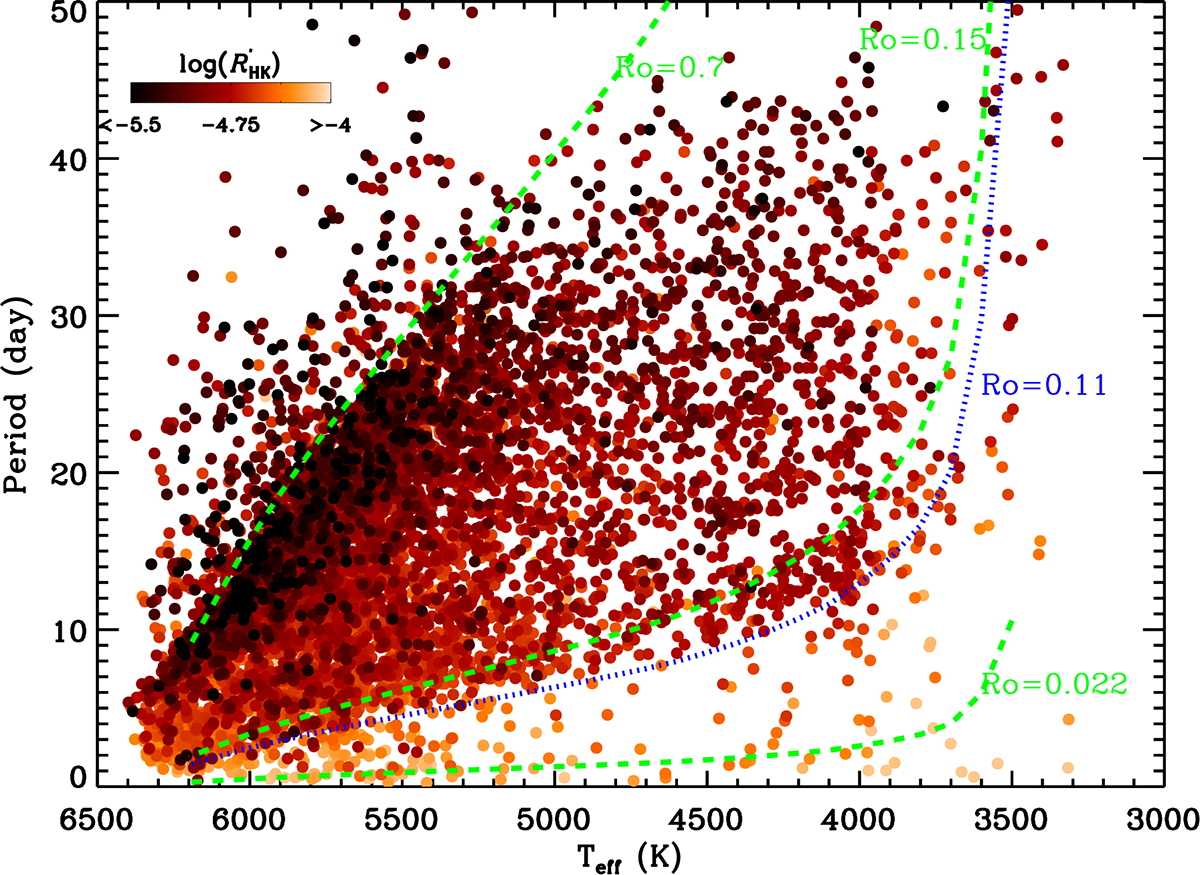
Effective temperature vs. rotation period. The color bar indicates the chromospheric activity ![]() . The green dashed lines denote the three critical Rossby number that separate the convective region, gap, the interface region, and the weakened magnetic braking region. The blue dotted line (Ro = 0.11) denotes the lower envelope of the Kepler slow rotator distribution, where fast rotators begin to converge. In order to clarify this lower envelope, we only plot the Kepler star of our sample (i.e., do not include stars of the two clusters).
. The green dashed lines denote the three critical Rossby number that separate the convective region, gap, the interface region, and the weakened magnetic braking region. The blue dotted line (Ro = 0.11) denotes the lower envelope of the Kepler slow rotator distribution, where fast rotators begin to converge. In order to clarify this lower envelope, we only plot the Kepler star of our sample (i.e., do not include stars of the two clusters).
Current usage metrics show cumulative count of Article Views (full-text article views including HTML views, PDF and ePub downloads, according to the available data) and Abstracts Views on Vision4Press platform.
Data correspond to usage on the plateform after 2015. The current usage metrics is available 48-96 hours after online publication and is updated daily on week days.
Initial download of the metrics may take a while.