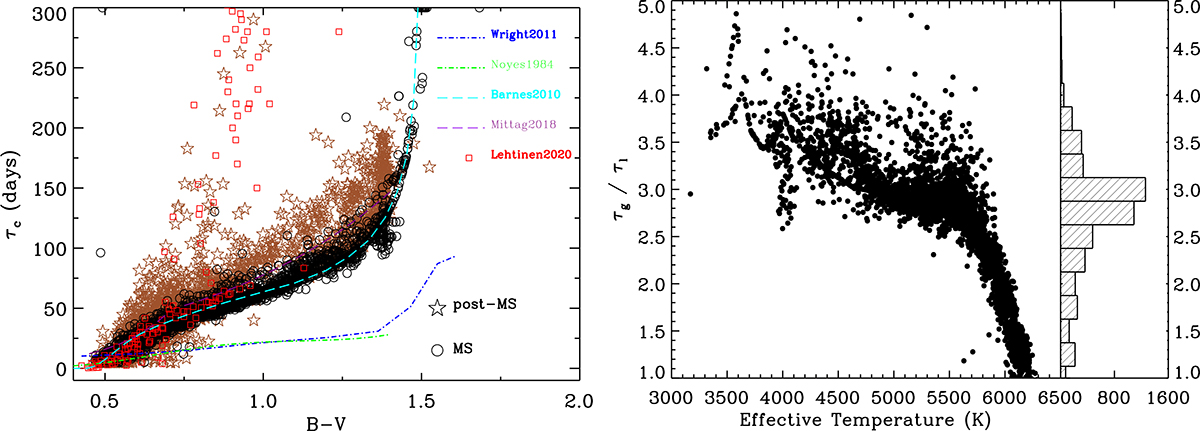
Fig. 4.
Download original image
Left panel: B−V vs. τc. The black open circles and five-point stars are MS and post-MS stars identified in Fig. 2. Red squares are from a MWO sample (Lehtinen et al. 2020) whose τg is also derived from the YaPSI model. We have plotted four reference relationships (dashed lines) indicating the local τc (Noyes et al. 1984; Wright et al. 2011) and the global τc (Barnes & Kim 2010; Mittag et al. 2018), after calibrating their B−V scale to this study. Right panel: Comparison between the YaPSI τg of MS stars and the empirical τl along with effective temperature.
Current usage metrics show cumulative count of Article Views (full-text article views including HTML views, PDF and ePub downloads, according to the available data) and Abstracts Views on Vision4Press platform.
Data correspond to usage on the plateform after 2015. The current usage metrics is available 48-96 hours after online publication and is updated daily on week days.
Initial download of the metrics may take a while.