Fig. E.1.
Download original image
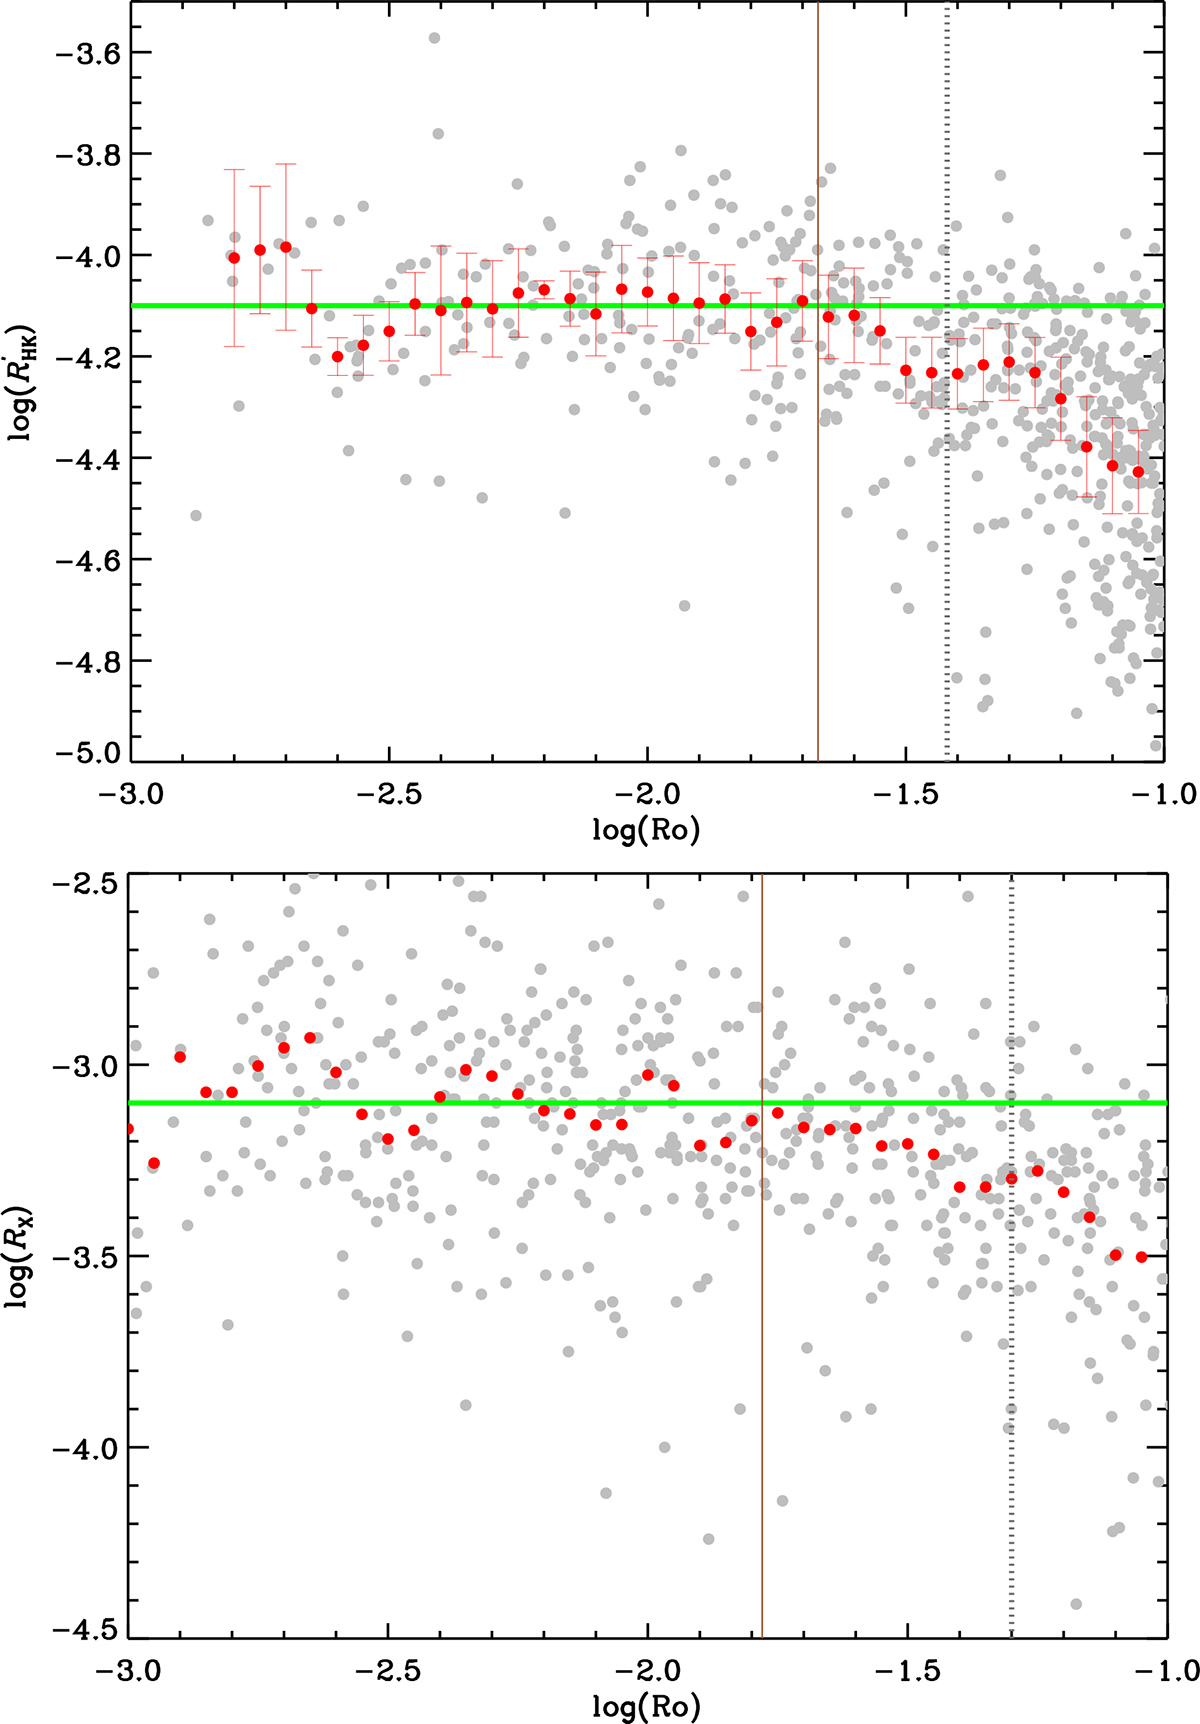
Top panel: Rotation–activity relationship in the saturation regime for chromospheric data. The green line indicates the saturation value ![]() . The red circles represent the mean
. The red circles represent the mean ![]() in a bin of 0.05 dex. The error bar is the mean error of
in a bin of 0.05 dex. The error bar is the mean error of ![]() in a bin. The vertical line indicates the critical Rossby number Ro = 0.022, where the chromospheric activity reaches the saturation. The dotted vertical line indicates Ro = 0.038 where the dichotomy separates the saturated and unsaturated regime. Bottom panel: Same as the top panel but for X-ray data. The vertical line indicates the critical Rossby number Ro = 0.017, where the X-ray activity reaches the saturation.The dotted vertical line indicates Ro = 0.05 where the dichotomy separates the saturated and unsaturated regime.
in a bin. The vertical line indicates the critical Rossby number Ro = 0.022, where the chromospheric activity reaches the saturation. The dotted vertical line indicates Ro = 0.038 where the dichotomy separates the saturated and unsaturated regime. Bottom panel: Same as the top panel but for X-ray data. The vertical line indicates the critical Rossby number Ro = 0.017, where the X-ray activity reaches the saturation.The dotted vertical line indicates Ro = 0.05 where the dichotomy separates the saturated and unsaturated regime.
Current usage metrics show cumulative count of Article Views (full-text article views including HTML views, PDF and ePub downloads, according to the available data) and Abstracts Views on Vision4Press platform.
Data correspond to usage on the plateform after 2015. The current usage metrics is available 48-96 hours after online publication and is updated daily on week days.
Initial download of the metrics may take a while.