Open Access
Fig. D.3.
Download original image
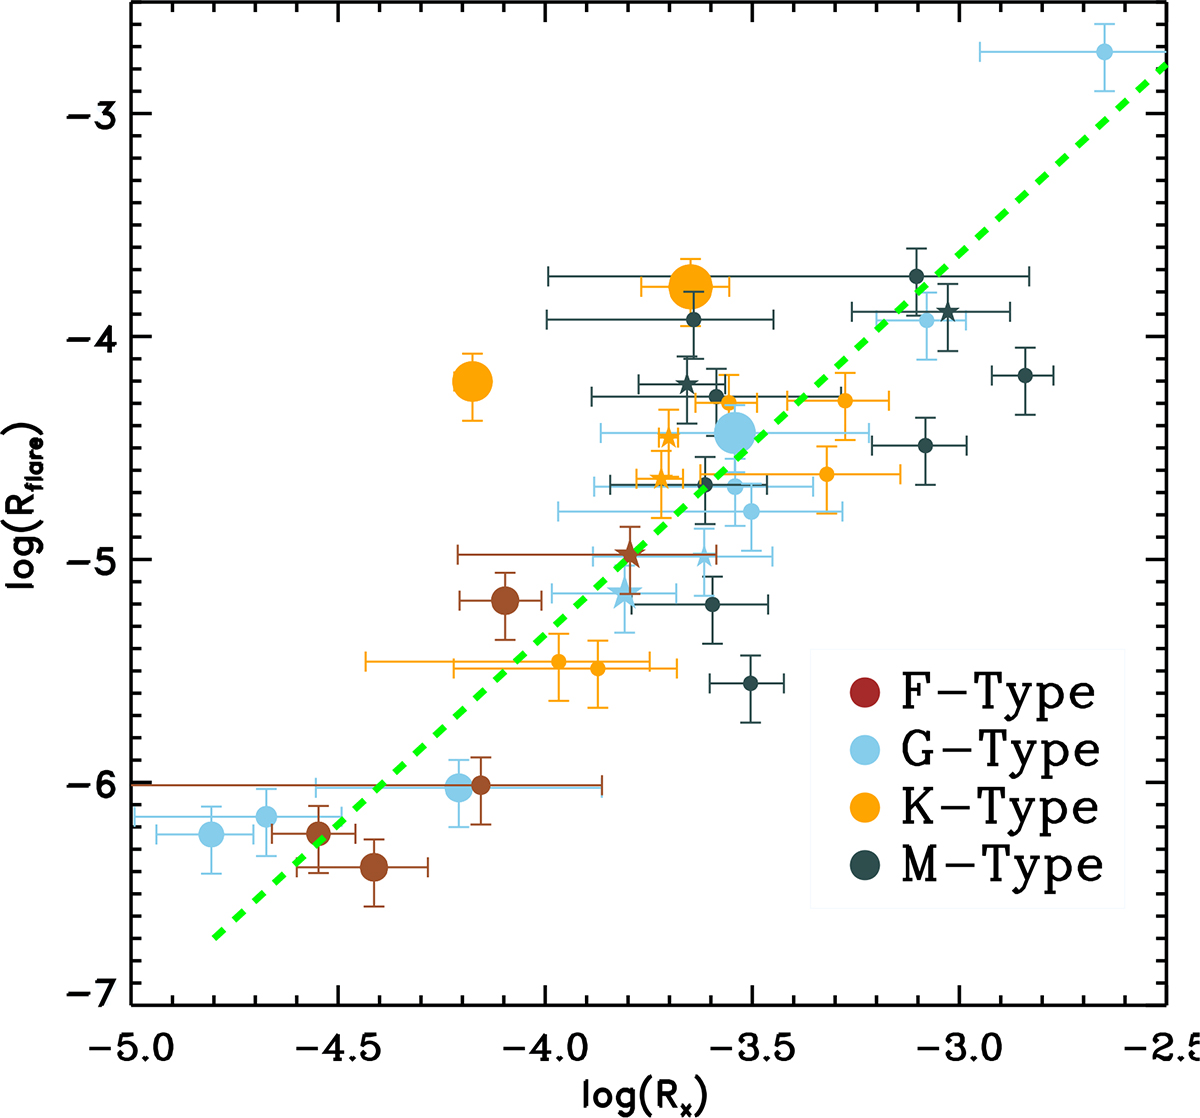
Coronal activity Rx vs. the flaring activity Rflare. There are 34 common stars with Rx and Rflare (Pizzocaro et al. 2019; Yang & Liu 2019). The green dashed line is the best fit given by a linear regression of the ordinary least-square bisector (Isobe et al. 1990). The meaning of symbols are as the same as Fig. D.1.
Current usage metrics show cumulative count of Article Views (full-text article views including HTML views, PDF and ePub downloads, according to the available data) and Abstracts Views on Vision4Press platform.
Data correspond to usage on the plateform after 2015. The current usage metrics is available 48-96 hours after online publication and is updated daily on week days.
Initial download of the metrics may take a while.