Fig. D.1.
Download original image
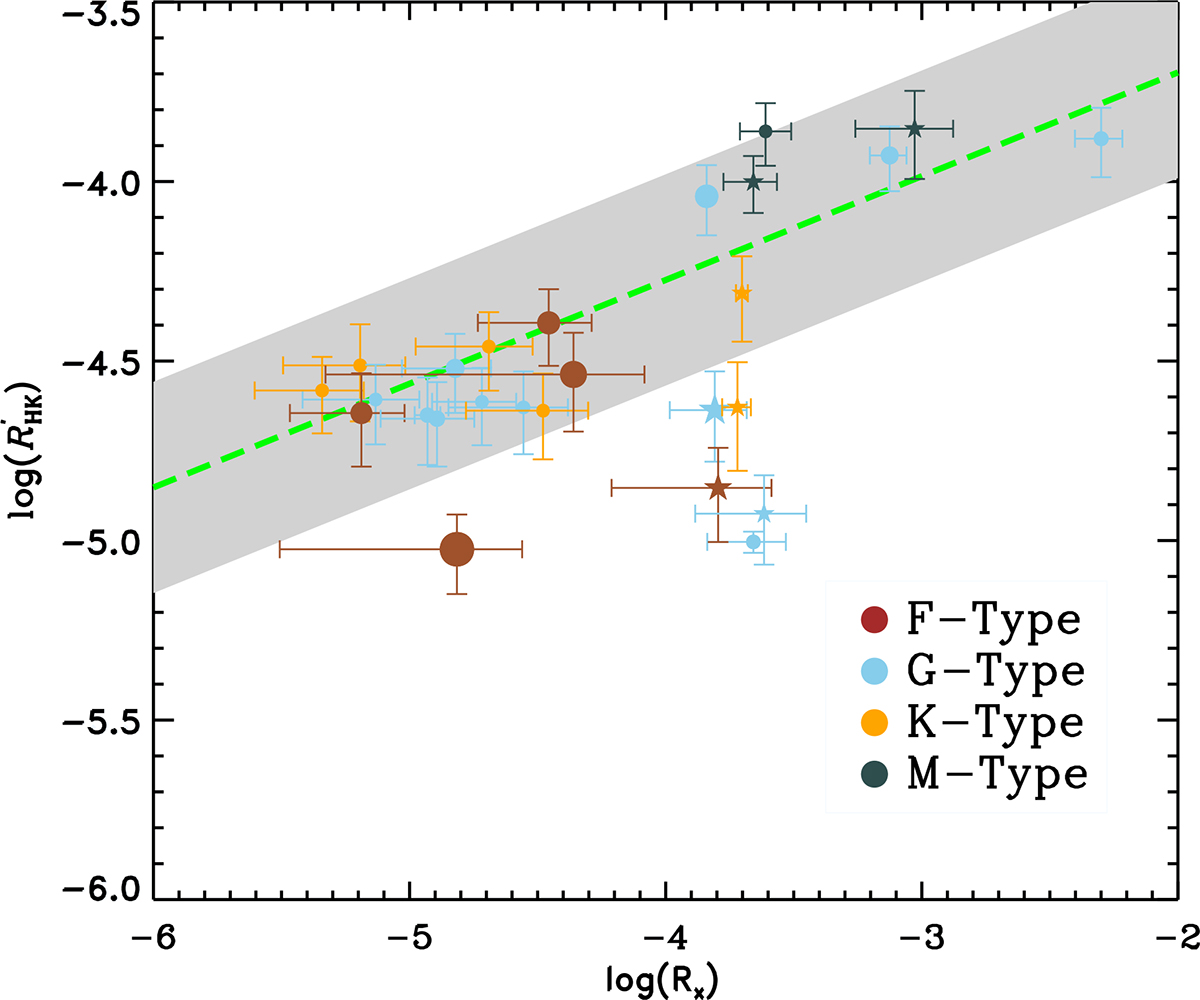
Coronal activity Rx vs. chromospheric activity ![]() . Our sample have 26 stars with Rx, three of them are from Wang et al. (2020) and the rest are from Pizzocaro et al. (2019). The green dashed line is given by Mamajek & Hillenbrand (2008), for which the boundary of the gray area indicates 1-σ level of the residuals of all the points. The symbol of five-pointed star indicates common stars among
. Our sample have 26 stars with Rx, three of them are from Wang et al. (2020) and the rest are from Pizzocaro et al. (2019). The green dashed line is given by Mamajek & Hillenbrand (2008), for which the boundary of the gray area indicates 1-σ level of the residuals of all the points. The symbol of five-pointed star indicates common stars among ![]() , RX and Rflare. The size of symbols represents the surface gravity log g which is the same as Fig. 6
, RX and Rflare. The size of symbols represents the surface gravity log g which is the same as Fig. 6
Current usage metrics show cumulative count of Article Views (full-text article views including HTML views, PDF and ePub downloads, according to the available data) and Abstracts Views on Vision4Press platform.
Data correspond to usage on the plateform after 2015. The current usage metrics is available 48-96 hours after online publication and is updated daily on week days.
Initial download of the metrics may take a while.