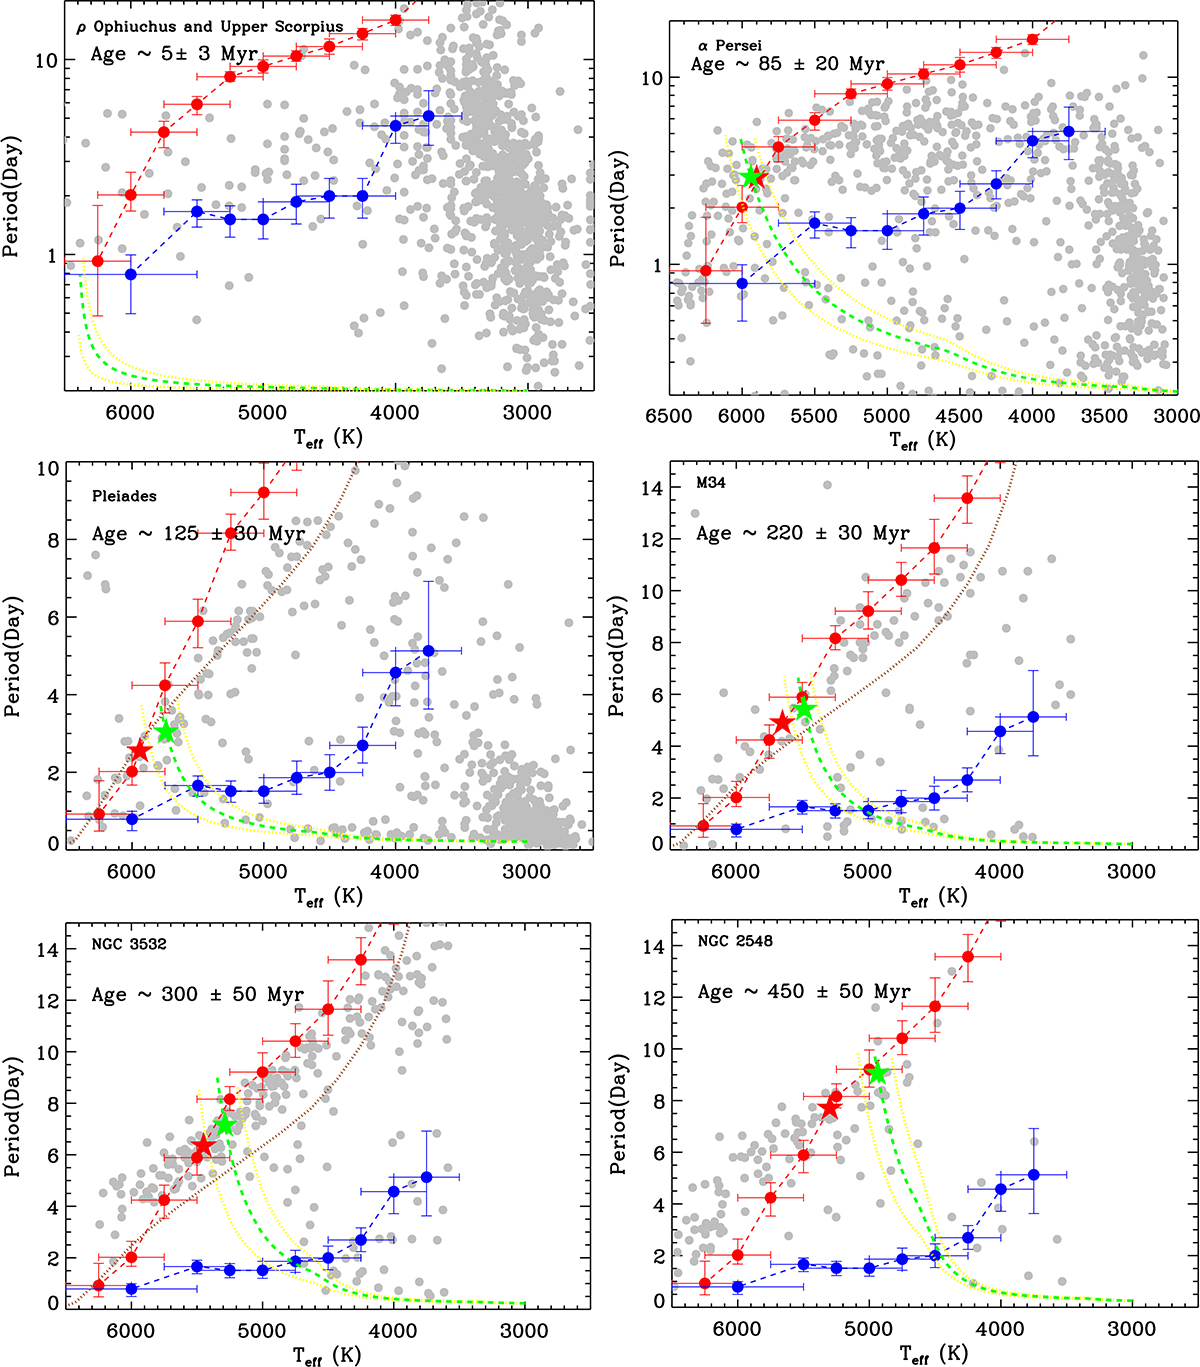
Fig. 13.
Download original image
Temperature–period diagrams for six open clusters. We have superimposed the C-to-g transition lines (the blue dashed lines), the g-to-I transition lines (the red dashed lines; the ZAIS lines), and the C-to-I evolution tracks of gyrochronology (the green dashed lines). The crossing points between the ZAIS lines and the slowly rotating sequence are marked with the red five-point stars. The convergent points between the C-to-I evolution tracks and the slowly rotating sequence are marked with the green five-point stars. The yellow dashed lines denote the upper and lower limit of the C-to-I evolution tracks from the uncertainty of the age in each panel. The brown dotted lines in Pleiades, M34 and NGC 3532 represent the lower envelope of the visually convergent sequence (Ro = 0.11, also see Fig. 7) to illustrate the pre-I sequence stars. Some references do not have the effective temperatures for their rotating stars. We convert their intrinsic color index (ρ Ophiuchus and Upper Scorpius: (V−K)0; M34 and NGC 3532: (B−V)0) to the effective temperature by using the tabulated data of Barnes & Kim (2010). We convert the (GBP−GRP)0 of NGC 2548 to the effective temperature by using the relation of Mucciarelli et al. (2021), in which the (GBP−GRP)0 is obtained by distance and extinction (see Appendix A).
Current usage metrics show cumulative count of Article Views (full-text article views including HTML views, PDF and ePub downloads, according to the available data) and Abstracts Views on Vision4Press platform.
Data correspond to usage on the plateform after 2015. The current usage metrics is available 48-96 hours after online publication and is updated daily on week days.
Initial download of the metrics may take a while.