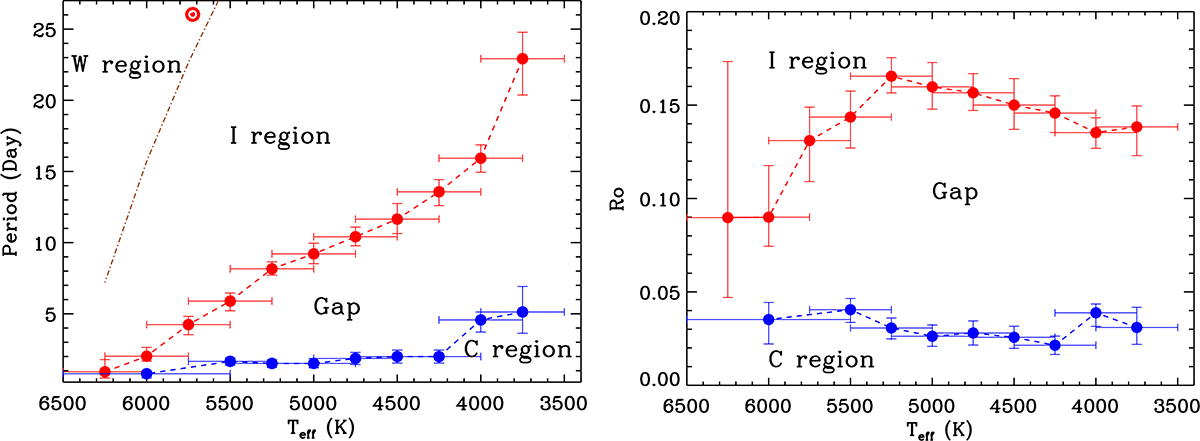
Fig. 11.
Download original image
Four regions in the color–period diagram. The red dashed lines denote the critical periods or Rossby number that separate the gap and I region in each temperature bin (the ZAIS line). The blue dashed lines denote the critical periods or Rossby number that separate the C and gap region in each temperature bin. The brown dashed line denotes the critical periods that separate the I region and the W region. The Sun is marked with an ⊙ symbol.
Current usage metrics show cumulative count of Article Views (full-text article views including HTML views, PDF and ePub downloads, according to the available data) and Abstracts Views on Vision4Press platform.
Data correspond to usage on the plateform after 2015. The current usage metrics is available 48-96 hours after online publication and is updated daily on week days.
Initial download of the metrics may take a while.