Fig. 9
Download original image
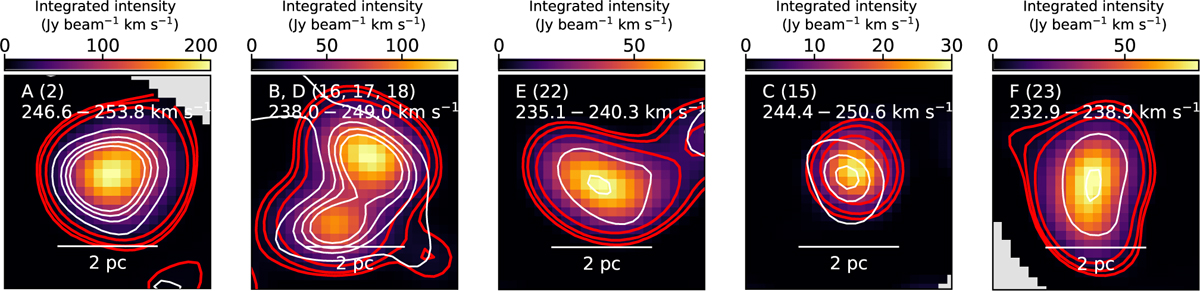
Velocity integrated images of 12CO emission for clumps 2, 15, 16, 17, 18, 22, and 23, together with the corresponding dust continuum contours. The areas of all gas clumps are larger than the areas covered by dust. The red contours correspond to 3, 5, and 10σ, where σ is the rms of each velocity integrated image (Table 9). The white contours correspond to the 1.5 and 3σ contours of the ALMA 0.88 mm continuum image, as in Figure 6.
Current usage metrics show cumulative count of Article Views (full-text article views including HTML views, PDF and ePub downloads, according to the available data) and Abstracts Views on Vision4Press platform.
Data correspond to usage on the plateform after 2015. The current usage metrics is available 48-96 hours after online publication and is updated daily on week days.
Initial download of the metrics may take a while.