Fig. 5
Download original image
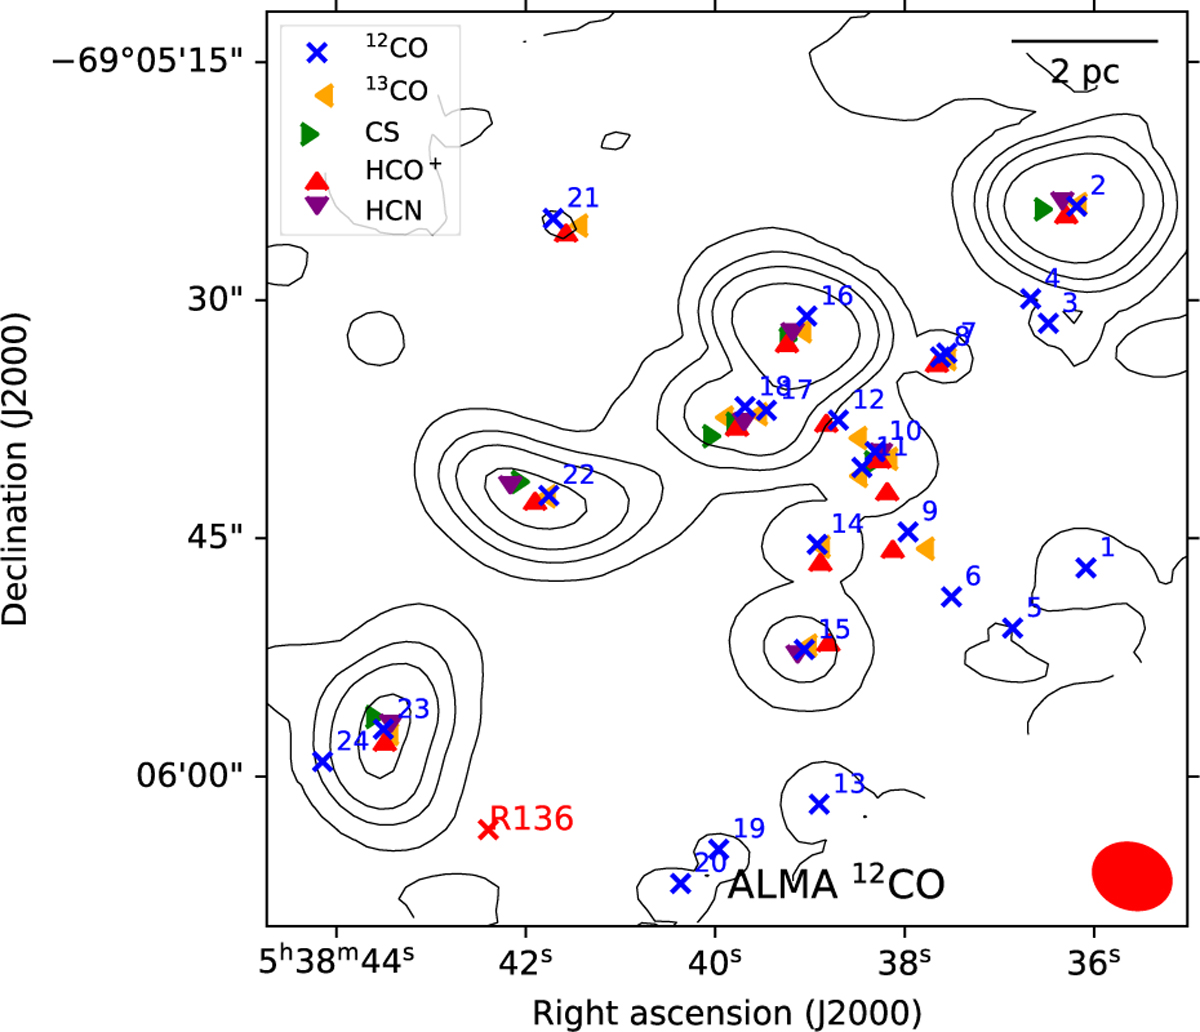
Central position of the clumps found in 12CO, 13CO, CS, HCO+, and HCN, plotted over contours of the peak main beam temperature of 12CO. The contours correspond to 5, 10, 100, and 200 times the rms of the 12CO line emission (47 mK). The blue crosses mark the central position of the clumps found in the 12CO in Sect. 3.1. The yellow arrowheads point toward the central positions of the 13CO clumps. The green arrowheads point toward the central positions of the CS clumps. The red arrowheads point toward the central positions of the HCO+ clumps. The purple arrowheads point toward the central positions of the HCN clumps. The red ellipse in the lower right corner represents the beam size.
Current usage metrics show cumulative count of Article Views (full-text article views including HTML views, PDF and ePub downloads, according to the available data) and Abstracts Views on Vision4Press platform.
Data correspond to usage on the plateform after 2015. The current usage metrics is available 48-96 hours after online publication and is updated daily on week days.
Initial download of the metrics may take a while.