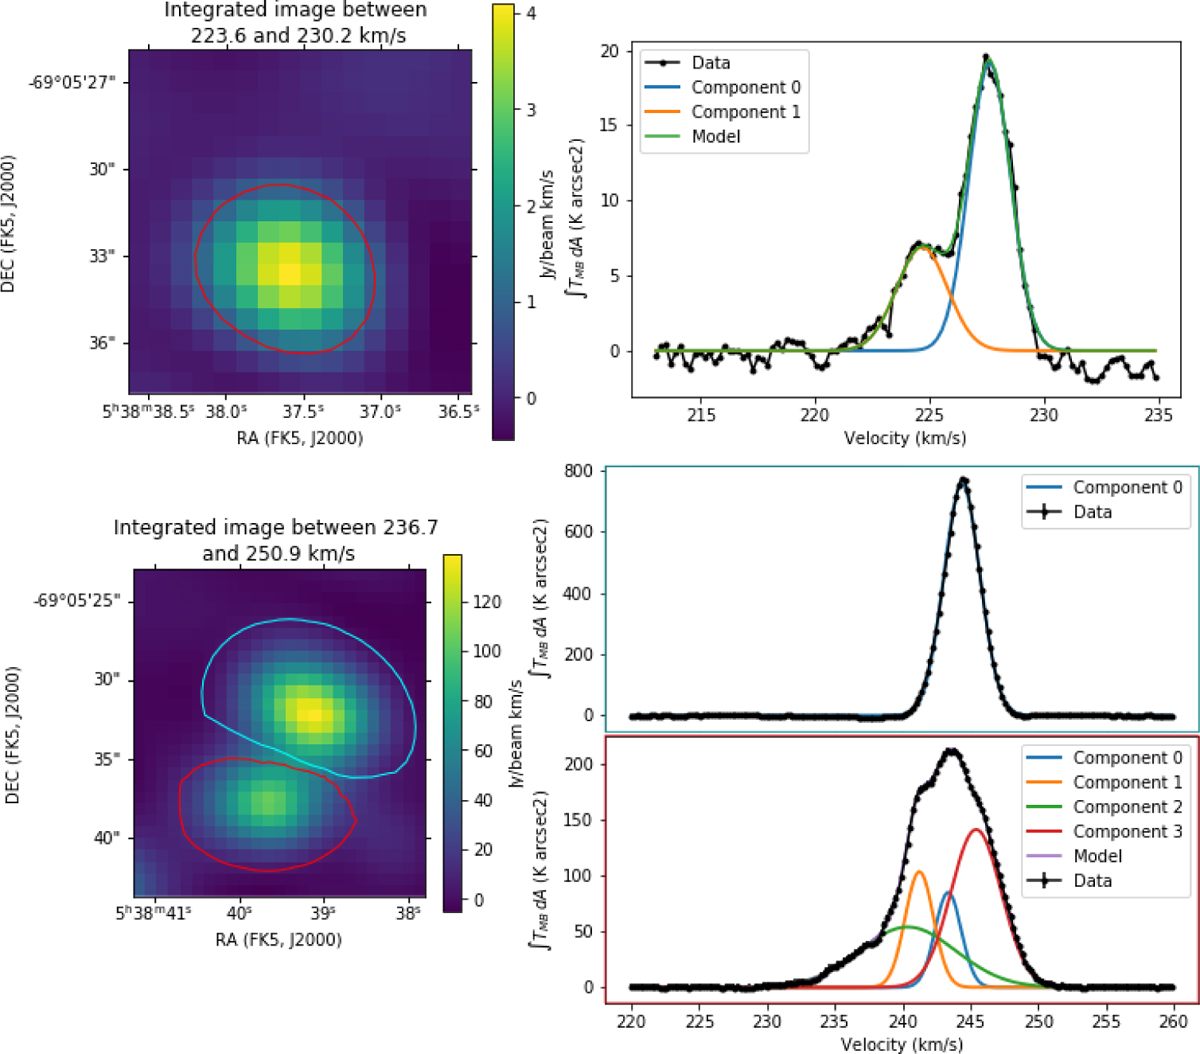
Fig. A.1

Download original image
Velocity integrated 12CO images in the locations of the five clumps we characterize manually (nos. 7, 8 , 16, 17, and 18), together with the integrated spectra in the delimited areas. Black points in the spectra correspond to the line emission data and colored lines correspond to the Gaussian fits to each clump. Top: 12CO emission integrated between 223.6 and 230.9 km/s (left), together with the integrated spectra in the red region in the integrated image (right). Gaussian component 0 (blue line) corresponds to emission from clump 8, and component 1 (orange line) to clump 7. Bottom: 12CO emission integrated between 236.7 and 250.9 km/s (left), together with the integrated spectra in the cyan and red regions marked in the integrated image (right). The integrated spectra at the top right corresponds to the spectra inside the cyan area. The integrated spectra at the bottom right corresponds to the one inside the red area. Gaussian component 0 (blue lines) from both spectra show line emission from clump 16 from Table 2. Gaussian component 2 (green line) from the bottom right spectra corresponds to emission from clump 22. Components 1 and 3 (orange and red lines) from the bottom right spectra corresponds to emission from clumps 18 and 17, respectively.
Current usage metrics show cumulative count of Article Views (full-text article views including HTML views, PDF and ePub downloads, according to the available data) and Abstracts Views on Vision4Press platform.
Data correspond to usage on the plateform after 2015. The current usage metrics is available 48-96 hours after online publication and is updated daily on week days.
Initial download of the metrics may take a while.


