Fig. 14
Download original image
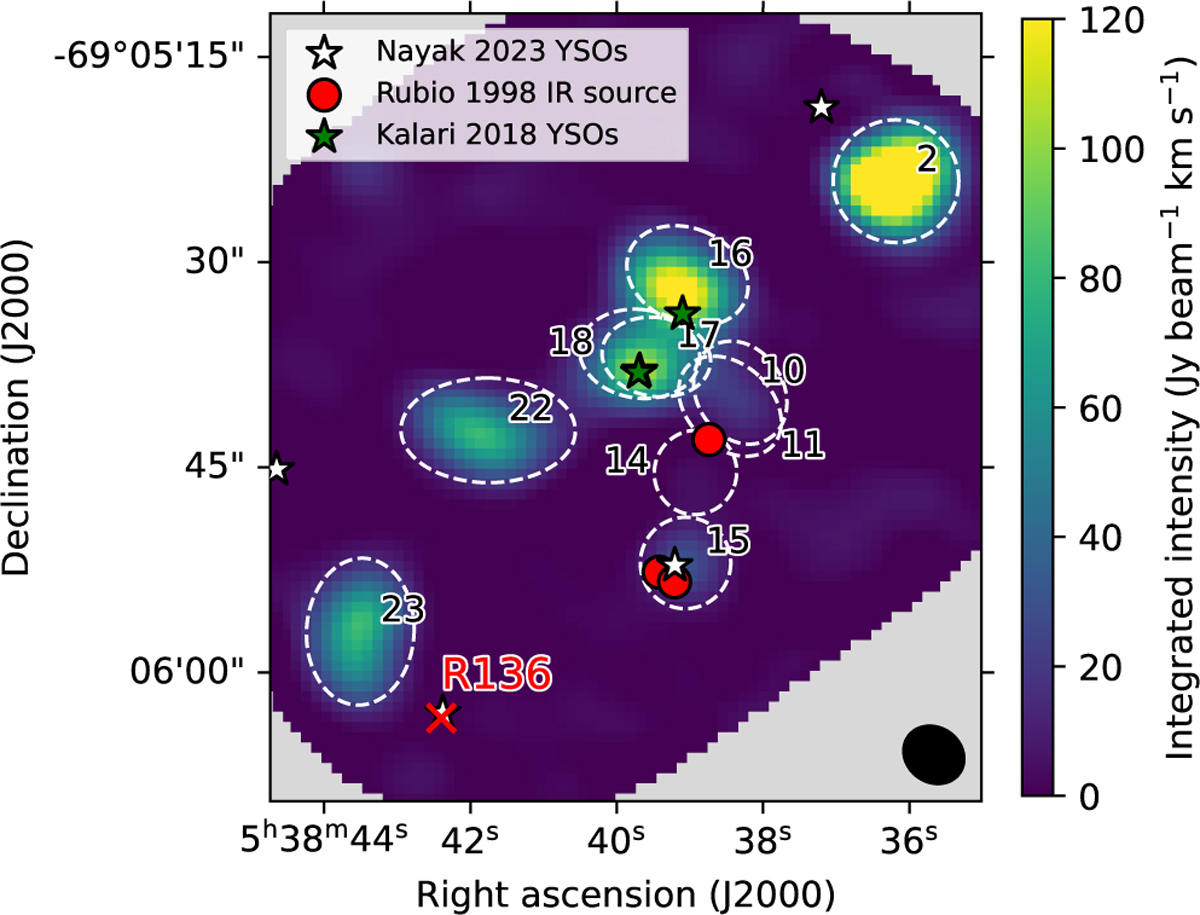
Velocity integrated image of 12CO emission between 235 and 250 km s-1 . The white dashed ellipses represent the position and sizes of the major and minor axes of clumps found in Sect. 3.1. The black labels over the ellipses correspond to the ID number of each clump. The white stars indicate the YSOs from the Nayak et al. (2023) catalog. The green stars indicate the YSOs identified in Kalari et al. (2018). The red points indicate the IR sources from the Rubio et al. (1998) catalog. The black ellipse in the bottom left corner represents the beam size.
Current usage metrics show cumulative count of Article Views (full-text article views including HTML views, PDF and ePub downloads, according to the available data) and Abstracts Views on Vision4Press platform.
Data correspond to usage on the plateform after 2015. The current usage metrics is available 48-96 hours after online publication and is updated daily on week days.
Initial download of the metrics may take a while.