Open Access
Fig. 13
Download original image
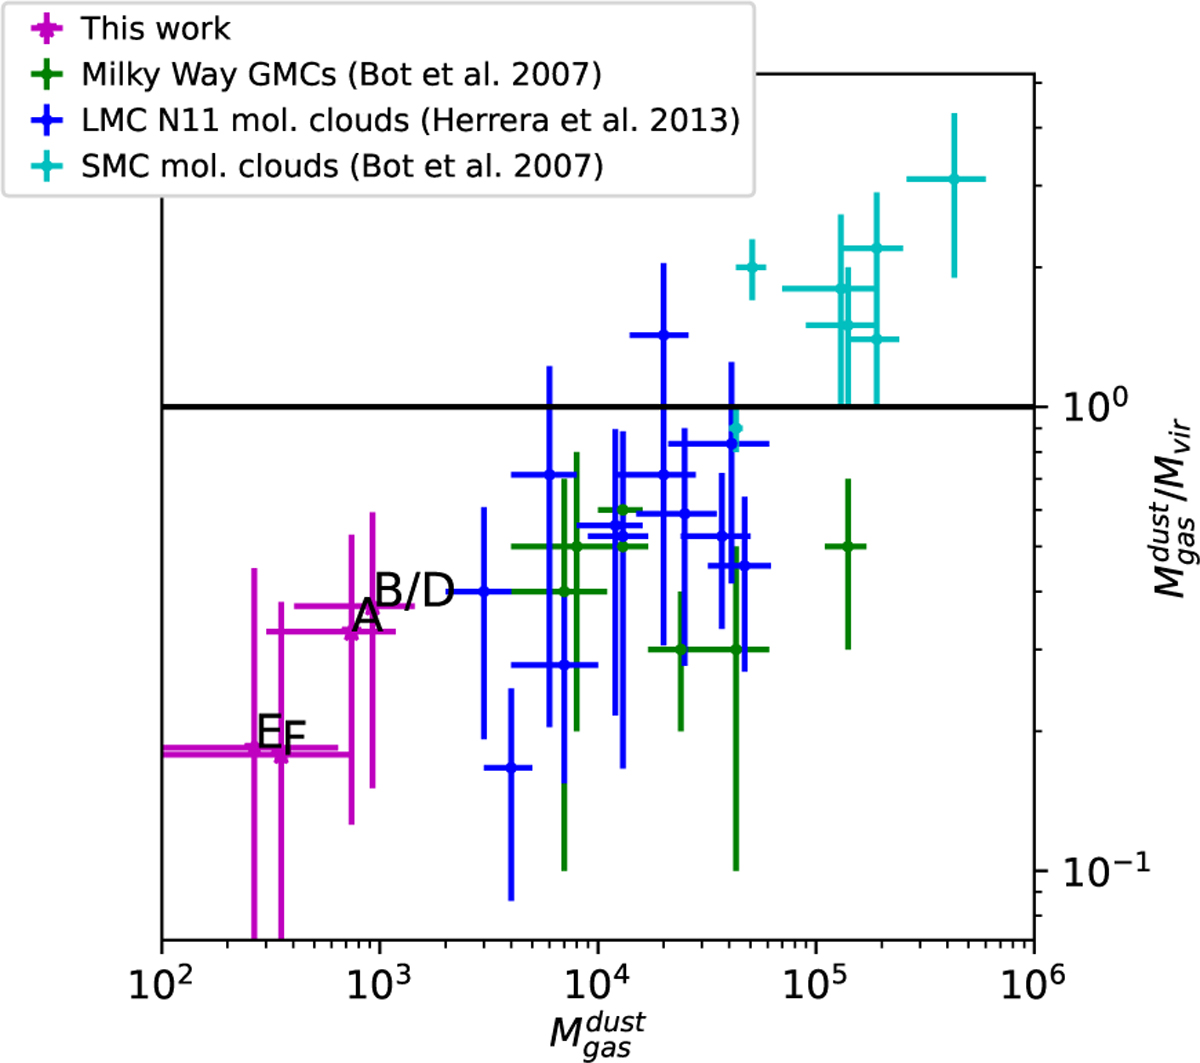
![]() plotted against the ratio
plotted against the ratio ![]() . We include the ratios found by Bot et al. (2007) in the SMC (cyan), Herrera et al. (2013) in N11 (blue), and Milky Way values calculated in Bot et al. (2007) (green). The clumps are labeled according to their 0.88 mm continuum labels. The horizontal black line marks the
. We include the ratios found by Bot et al. (2007) in the SMC (cyan), Herrera et al. (2013) in N11 (blue), and Milky Way values calculated in Bot et al. (2007) (green). The clumps are labeled according to their 0.88 mm continuum labels. The horizontal black line marks the ![]() equality.
equality.
Current usage metrics show cumulative count of Article Views (full-text article views including HTML views, PDF and ePub downloads, according to the available data) and Abstracts Views on Vision4Press platform.
Data correspond to usage on the plateform after 2015. The current usage metrics is available 48-96 hours after online publication and is updated daily on week days.
Initial download of the metrics may take a while.