Fig. 12
Download original image
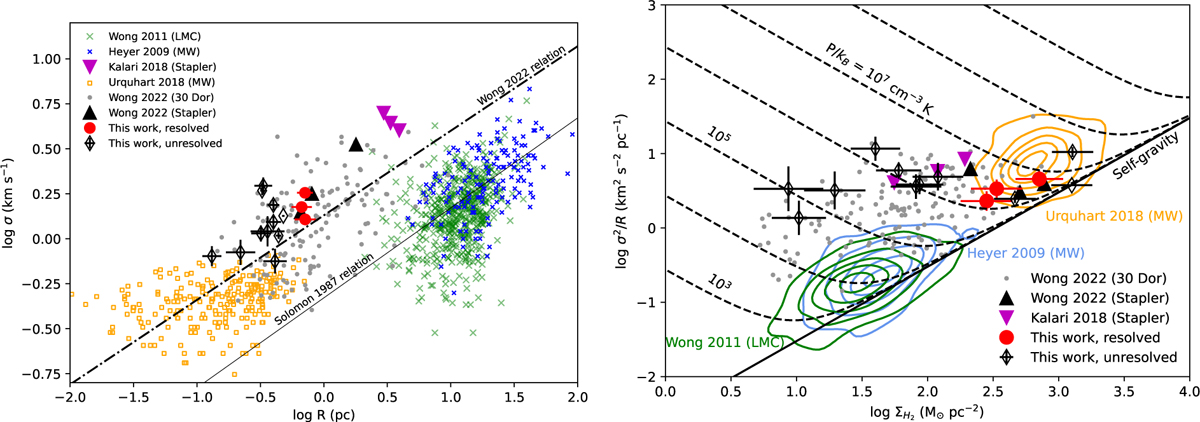
Relationships between physical properties of our sample, together with results in this same region found in Kalari et al. (2018), in 30 Dor from Wong et al. (2022) with ~ 1″ resolution, in the LMC from Wong et al. (2011 ), in Milky Way clouds from Heyer et al. (2009) and inner Galaxy dense clumps from ATLASGAL (Urquhart et al. 2018). Our CPROPS clumps are shown in red and black in both plots. The filled circles represent completely resolved clumps, whereas the empty diamonds correspond to clumps that have one unresolved axis. Left: R vs σv relationship for molecular clouds in the LMC and the Milky Way. The black line represents the canonical relation σv = 0.72R0.5, followed by the Milky Way clouds (Solomon et al. 1987), whereas the dash-dotted line marks the relation found in Wong et al. (2022). Right: ![]() vs ΣH2 relationship for molecular clouds in different galaxies, including our results and other regions in 30 Dor, the LMC, and the Milky Way. The solid black line represents the approximate
vs ΣH2 relationship for molecular clouds in different galaxies, including our results and other regions in 30 Dor, the LMC, and the Milky Way. The solid black line represents the approximate ![]() value for increasing
value for increasing ![]() of a centrally concentrated, virialized clump confined only by self-gravity. The dashed lines represent the relation between
of a centrally concentrated, virialized clump confined only by self-gravity. The dashed lines represent the relation between ![]() and
and ![]() for clumps with σv affected by self-gravity and external pressure, covering the range P/kB = 103-109 cm-3 K (Field et al. 2011).
for clumps with σv affected by self-gravity and external pressure, covering the range P/kB = 103-109 cm-3 K (Field et al. 2011).
Current usage metrics show cumulative count of Article Views (full-text article views including HTML views, PDF and ePub downloads, according to the available data) and Abstracts Views on Vision4Press platform.
Data correspond to usage on the plateform after 2015. The current usage metrics is available 48-96 hours after online publication and is updated daily on week days.
Initial download of the metrics may take a while.