Open Access
Fig. 11
Download original image
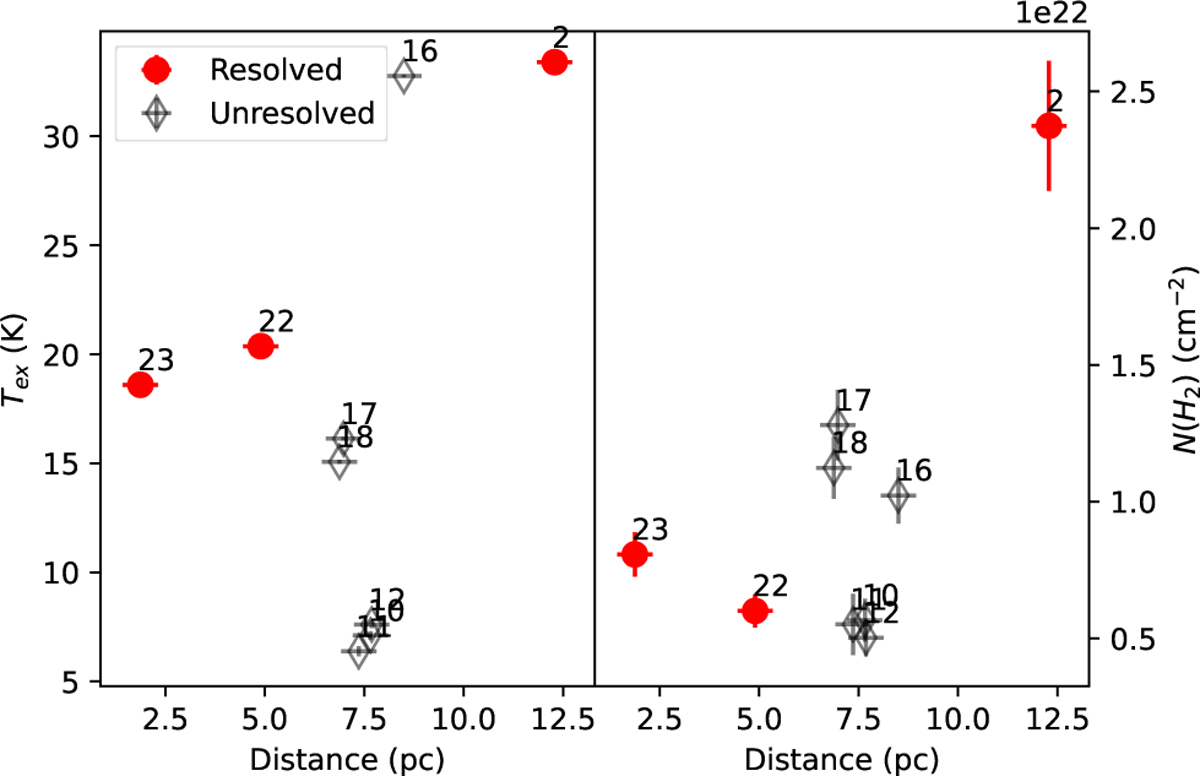
Observed properties of the clumps obtained through LTE analysis, with respect to projected distance to R136a1. The colors are the same as in Fig. 10.
Current usage metrics show cumulative count of Article Views (full-text article views including HTML views, PDF and ePub downloads, according to the available data) and Abstracts Views on Vision4Press platform.
Data correspond to usage on the plateform after 2015. The current usage metrics is available 48-96 hours after online publication and is updated daily on week days.
Initial download of the metrics may take a while.