Fig. 10
Download original image
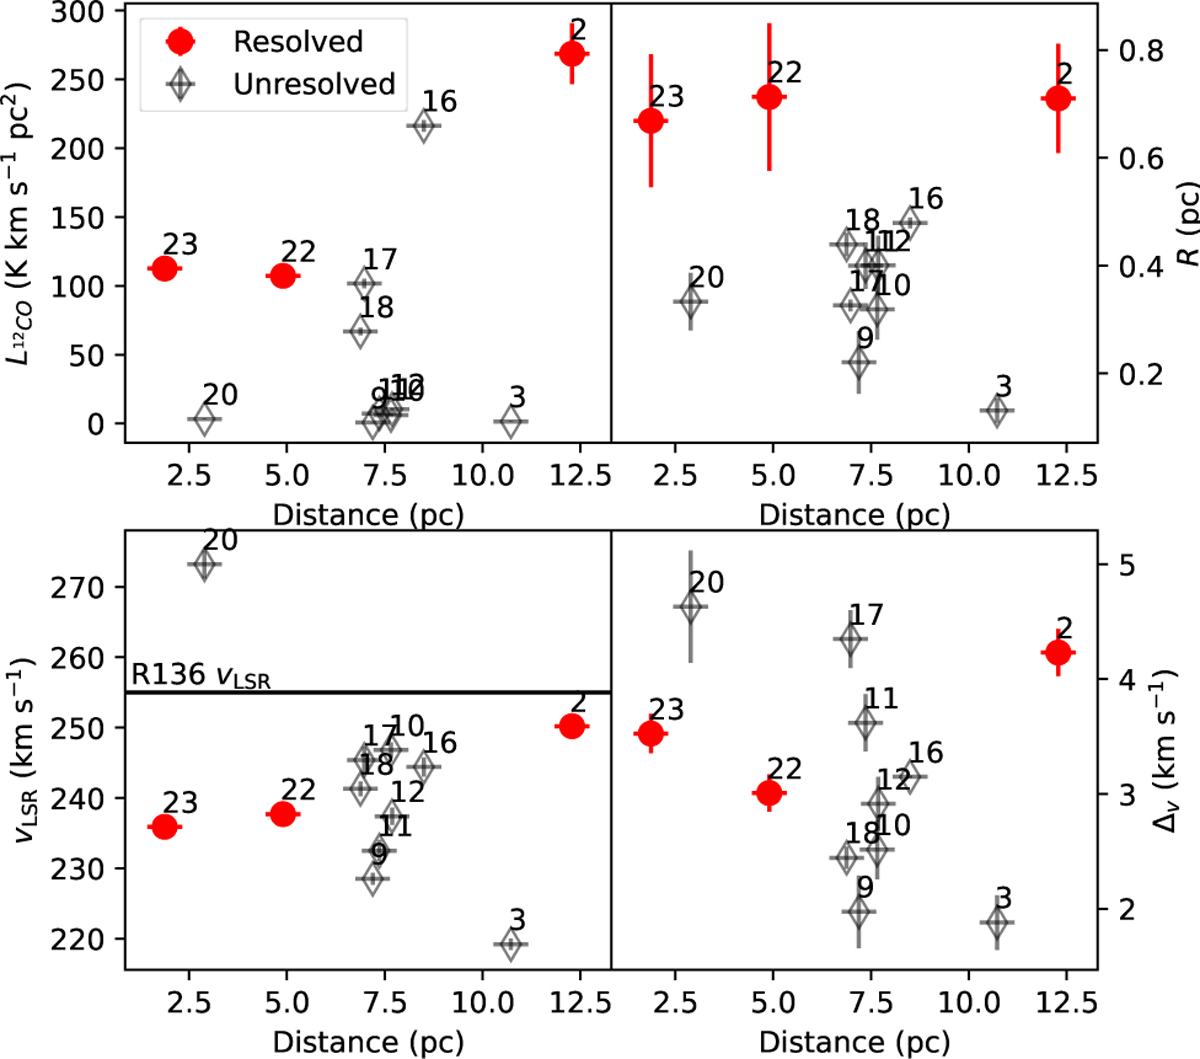
Observed properties of the clumps obtained from 12CO emission, with respect to projected distance to R136a1. The red points represent the fully resolved clumps from Table 4, whereas the empty black diamonds show the clumps where one axis is unresolved. The black horizontal line represents the vLSR of the R136 cluster (Evans et al. 2015).
Current usage metrics show cumulative count of Article Views (full-text article views including HTML views, PDF and ePub downloads, according to the available data) and Abstracts Views on Vision4Press platform.
Data correspond to usage on the plateform after 2015. The current usage metrics is available 48-96 hours after online publication and is updated daily on week days.
Initial download of the metrics may take a while.