Fig. 7
Download original image
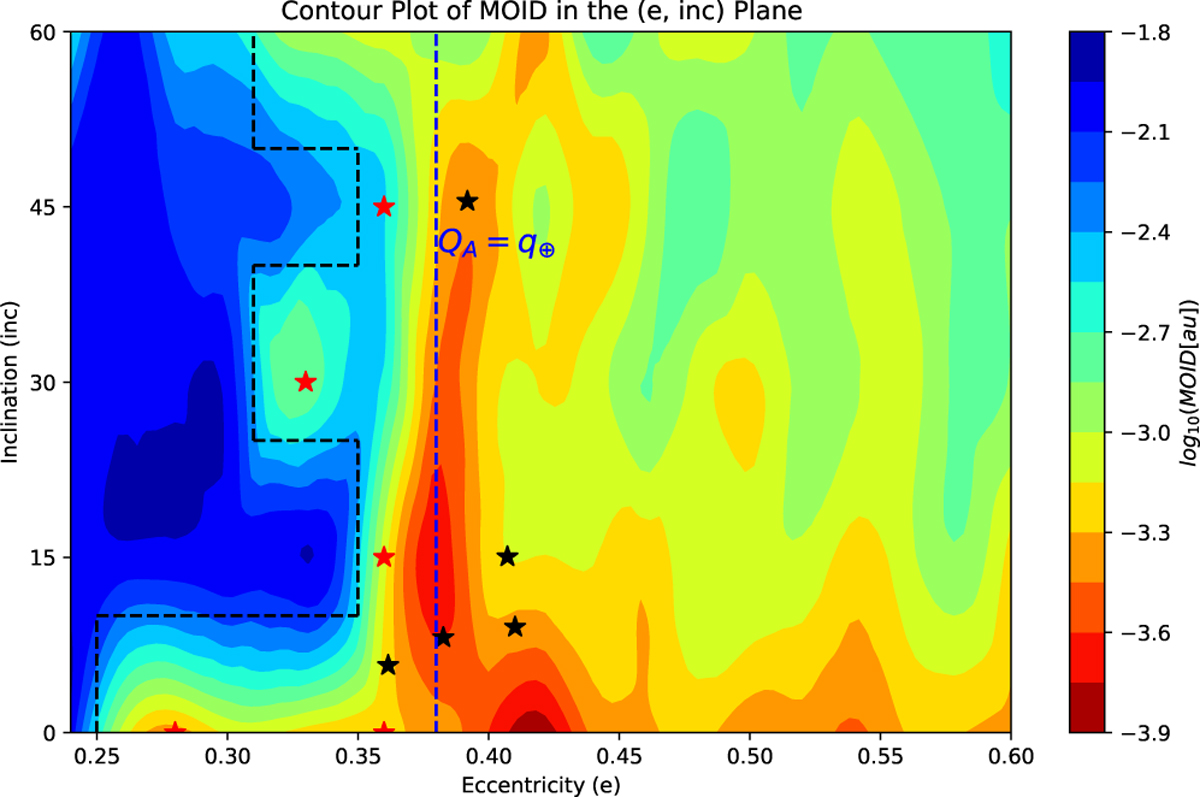
Contour plot of the MOID with Earth as a function of the initial (e, inc) values. The vertical line displays e = 0.38, for which the apocenter of the Venus co-orbital asteroid is equal to Earth’s pericenter. The black stars display the location of the real co-orbitals of Venus with a MOID with Earth of 0.0005 au or less. The red stars show the orbital location of five test particles at e < 0.38 that experienced low MOIDs in our simulations. The dashed black line shows the approximate boundary of the low-MOID region.
Current usage metrics show cumulative count of Article Views (full-text article views including HTML views, PDF and ePub downloads, according to the available data) and Abstracts Views on Vision4Press platform.
Data correspond to usage on the plateform after 2015. The current usage metrics is available 48-96 hours after online publication and is updated daily on week days.
Initial download of the metrics may take a while.